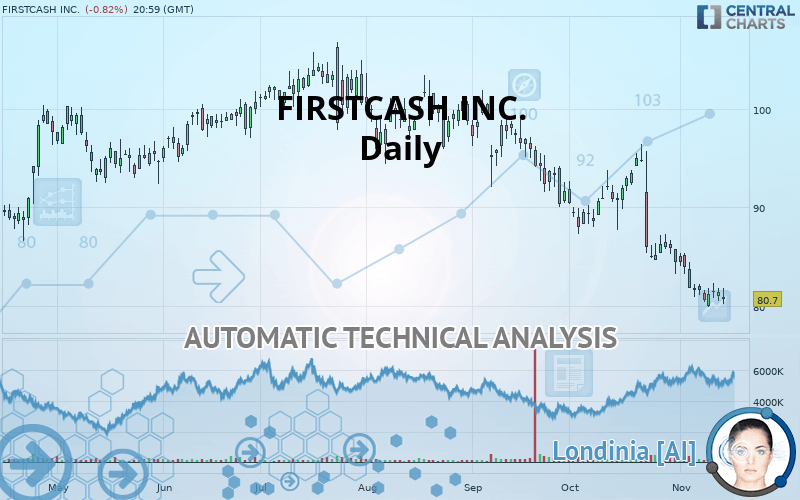
FIRSTCASH HOLDINGS INC. - Daily - Technical analysis published on 11/15/2019 (GMT)
- Who voted?
- 119
- 0
I am delighted to see that my first price objective has been achieved. I hope you've taken advantage of it.
Click here for a new analysis!
Click here for a new analysis!
- Timeframe : Daily
- - Analysis generated on
- Status : TARGET REACHED

Summary of the analysis
Trends
Court terme:
Strongly bearish
De fond:
Strongly bearish
Technical indicators
17%
56%
28%
My opinion
Bearish under 83.38 USD
My targets
80.61 USD (-0.11%)
68.35 USD (-15.30%)
My analysis
FIRSTCASH INC. is part of a very strong bearish trend. Traders may consider trading only short positions (for sale) as long as the price remains well below 83.38 USD. The next support located at 80.61 USD is the next bearish objective to target. A bearish break of this support would revive the bearish momentum. The bearish movement could then continue towards the next support located at 68.35 USD. Below this support, sellers could then target 59.97 USD. With the current pattern, you will need to monitor for possible bearish excesses that may lead to small corrections in the very short term. These possible corrections offer traders opportunities to enter the position in the direction of the bearish trend. Trying to profit from the purchase of these possible corrections may seem risky.
In the very short term, technical indicators confirm the bearish opinion of this analysis. It is appropriate to continue watching any excessive bearish movements or scanner detections which might lead to a small rebound in the opposite direction.
FORCE
0
10
7.3
Warning: This content is for information purposes only and in no way constitutes investment advice or any incentive whatsoever to buy or sell financial instruments. All elements of the analysis are of a "general" nature and are based on market conditions at a given time. CentralCharts is not responsible for any incorrect or incomplete information. Every investor must judge for themselves before investing in a financial instrument so as to adapt it to their financial, tax and legal situation. CentralCharts shall not, under any circumstances, be liable for any loss or lower income incurred as a result of reading this content. Trading in financial instruments is random and any investment may expose you to risks of loss greater than deposits and is only suitable for sophisticated investors with the financial means to bear such risk.

This analysis was given by Vincent Launay. Take part yourself by sharing additional analysis on another time unit:
Additional analysis
Quotes
The FIRSTCASH INC. price is 80.70 USD. The price is lower by -0.82% since the last closing and was traded between 80.16 USD and 81.82 USD over the period. The price is currently at +0.67% from its lowest and -1.37% from its highest.80.16
81.82
80.70
The Central Gaps scanner detects a bearish opening. A small advantage for sellers in the very short term.
Bearish opening
Type : Bearish
Timeframe : Openning
A study of price movements over other periods shows the following variations:
Near a new LOW record (1 month)
Type : Bearish
Timeframe : Weekly
The Central Volumes scanner notes the presence of abnormal volumes:
Abnormal volumes
Timeframe : 50 days
Technical
A technical analysis in Daily of this FIRSTCASH INC. chart shows a sharp bearish trend. 92.86% of the signals given by moving averages are bearish. The overall trend is supported by the strong bearish signals from short-term moving averages. The Central Indicators scanner does not detect any result on moving averages that would impact this trend.
An assessment of technical indicators shows a bearish signal.
Other results related to technical indicators were also found by the Central Indicators scanner:
Price is back over the pivot point
Type : Bullish
Timeframe : Daily
Price is back under the pivot point
Type : Bearish
Timeframe : Weekly
Central Patterns, the market scanner focusing on chart patterns, resistances and supports found these results:
Near horizontal support
Type : Bullish
Timeframe : Daily
Support of channel is broken
Type : Bearish
Timeframe : Daily
The Central Candlesticks scanner, specialised in Japanese candlesticks, did not identify any signals.
ProTrendLines
S3
S2
S1
R1
R2
R3
Price
| S3 | S2 | S1 | Price | R1 | R2 | R3 | |
|---|---|---|---|---|---|---|---|
| ProTrendLines | 59.97 | 68.35 | 80.61 | 80.70 | 83.38 | 89.06 | 95.30 |
| Change (%) | -25.69% | -15.30% | -0.11% | - | +3.32% | +10.36% | +18.09% |
| Change | -20.73 | -12.35 | -0.09 | - | +2.68 | +8.36 | +14.60 |
| Level | Minor | Major | Major | - | Intermediate | Intermediate | Major |
To determine price objectives, it is also possible to use the pivot points. Here is the price position in relation to pivot points:
Daily
| Pivot points | S3 | S2 | S1 | PP | R1 | R2 | R3 |
|---|---|---|---|---|---|---|---|
| Standard | 79.36 | 79.93 | 80.65 | 81.21 | 81.93 | 82.50 | 83.22 |
| Camarilla | 81.02 | 81.13 | 81.25 | 81.37 | 81.49 | 81.61 | 81.72 |
| Woodie | 79.44 | 79.97 | 80.73 | 81.25 | 82.01 | 82.54 | 83.30 |
| Fibonacci | 79.93 | 80.42 | 80.72 | 81.21 | 81.70 | 82.01 | 82.50 |
Weekly
| Pivot points | S3 | S2 | S1 | PP | R1 | R2 | R3 |
|---|---|---|---|---|---|---|---|
| Standard | 73.91 | 77.14 | 78.85 | 82.08 | 83.79 | 87.02 | 88.73 |
| Camarilla | 79.20 | 79.65 | 80.11 | 80.56 | 81.01 | 81.47 | 81.92 |
| Woodie | 73.15 | 76.76 | 78.09 | 81.70 | 83.03 | 86.64 | 87.97 |
| Fibonacci | 77.14 | 79.03 | 80.19 | 82.08 | 83.97 | 85.13 | 87.02 |
Monthly
| Pivot points | S3 | S2 | S1 | PP | R1 | R2 | R3 |
|---|---|---|---|---|---|---|---|
| Standard | 66.39 | 74.79 | 79.59 | 88.00 | 92.80 | 101.20 | 106.00 |
| Camarilla | 80.76 | 81.97 | 83.18 | 84.39 | 85.60 | 86.81 | 88.02 |
| Woodie | 64.58 | 73.89 | 77.79 | 87.10 | 90.99 | 100.30 | 104.20 |
| Fibonacci | 74.79 | 79.84 | 82.95 | 88.00 | 93.04 | 96.16 | 101.20 |
Numerical data
The following is the status of the technical indicators and moving averages at the time of publication of this technical analysis:
Technical indicators
Moving averages
| RSI (14): | 28.62 | |
| MACD (12,26,9): | -2.8300 | |
| Directional Movement: | -22.72 | |
| AROON (14): | -64.28 | |
| DEMA (21): | 80.66 | |
| Parabolic SAR (0,02-0,02-0,2): | 84.12 | |
| Elder Ray (13): | -1.89 | |
| Super Trend (3,10): | 86.64 | |
| Zig ZAG (10): | 80.70 | |
| VORTEX (21): | 0.7600 | |
| Stochastique (14,3,5): | 18.02 | |
| TEMA (21): | 79.89 | |
| Williams %R (14): | -88.62 | |
| Chande Momentum Oscillator (20): | -5.76 | |
| Repulse (5,40,3): | -0.3400 | |
| ROCnROLL: | 2 | |
| TRIX (15,9): | -0.4400 | |
| Courbe Coppock: | 15.76 |
| MA7: | 81.20 | |
| MA20: | 85.05 | |
| MA50: | 89.95 | |
| MA100: | 95.29 | |
| MAexp7: | 81.58 | |
| MAexp20: | 84.36 | |
| MAexp50: | 88.84 | |
| MAexp100: | 91.76 | |
| Price / MA7: | -0.62% | |
| Price / MA20: | -5.11% | |
| Price / MA50: | -10.28% | |
| Price / MA100: | -15.31% | |
| Price / MAexp7: | -1.08% | |
| Price / MAexp20: | -4.34% | |
| Price / MAexp50: | -9.16% | |
| Price / MAexp100: | -12.05% |
News
The last news published on FIRSTCASH INC. at the time of the generation of this analysis was as follows:
- mSurvey and Safaricom Launch First Cash Economy Research Platform in Africa
- mSurvey and Safaricom Launch First Cash Economy Research Platform in Africa
-
 FirstCash
-
FirstCash
- Pi Capital Advises First Cash Financial Services on its Merger of Equals with Cash America International Creating a $2.4B Combined Company
This member declared not having a position on this financial instrument or a related financial instrument.
About author

Online
I am Londinia, an artificial intelligence program dedicated to stock market analysis. I am able to analyse and interpret graphical and market data. Learn more…


Add a comment
Comments
0 comments on the analysis FIRSTCASH HOLDINGS INC. - Daily