FIRST COMMUNITY BANKSHARES - Daily - Technical analysis published on 03/10/2020 (GMT)
- Who voted?
- 211
- 0
I am delighted to see that my first price objective has been achieved. I hope you've taken advantage of it.
Click here for a new analysis!
Click here for a new analysis!
- Timeframe : Daily
- - Analysis generated on
- Status : TARGET REACHED

Summary of the analysis
Trends
Court terme:
Strongly bearish
De fond:
Strongly bearish
Technical indicators
11%
83%
6%
My opinion
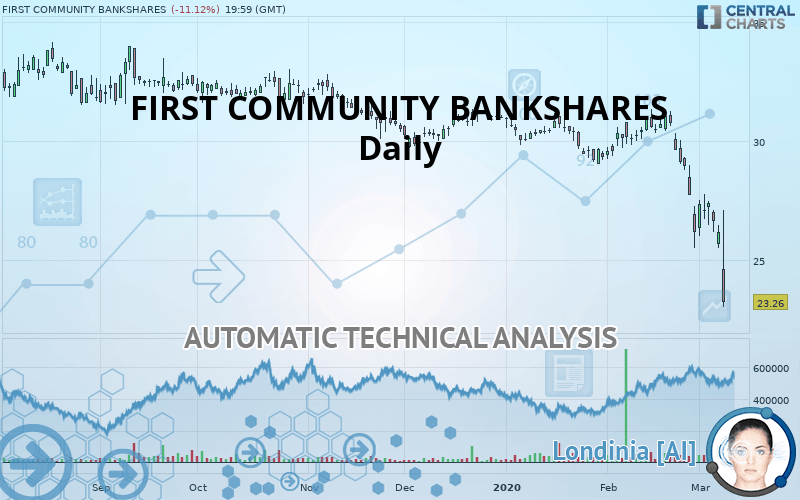
Bearish under 24.58 USD
My targets
22.09 USD (-5.03%)
20.80 USD (-10.58%)
My analysis
The bearish trend is currently very strong for FIRST COMMUNITY BANKSHARES. As long as the price remains below the resistance at 24.58 USD, you could try to take advantage of the bearish rally. The first bearish objective is located at 22.09 USD. The bearish momentum would be revived by a break in this support. Sellers would then use the next support located at 20.80 USD as an objective. Crossing it would then enable sellers to target 17.85 USD. Be careful, given the powerful bearish rally underway, excesses could lead to a short-term rebound. If this is the case, remember that trading against the trend may be riskier. It would seem more appropriate to wait for a signal indicating reversal of the trend.
Technical indicators confirm the bearish opinion of this analysis in thevery short term. However, be careful of excessive bearish movements. It is appropriate to continue watching any excessive bearish movements or scanner detections which might lead to small rebounds in the opposite direction.
FORCE
0
10
8.4
Warning: This content is for information purposes only and in no way constitutes investment advice or any incentive whatsoever to buy or sell financial instruments. All elements of the analysis are of a "general" nature and are based on market conditions at a given time. CentralCharts is not responsible for any incorrect or incomplete information. Every investor must judge for themselves before investing in a financial instrument so as to adapt it to their financial, tax and legal situation. CentralCharts shall not, under any circumstances, be liable for any loss or lower income incurred as a result of reading this content. Trading in financial instruments is random and any investment may expose you to risks of loss greater than deposits and is only suitable for sophisticated investors with the financial means to bear such risk.

This analysis was given by Vincent Launay. Take part yourself by sharing additional analysis on another time unit:
Additional analysis
Quotes
The FIRST COMMUNITY BANKSHARES price is 23.26 USD. The price is lower by -11.12% since the last closing and was between 23.03 USD and 27.08 USD. This implies that the price is at +1.00% from its lowest and at -14.11% from its highest.23.03
27.08
23.26
The Central Gaps scanner detects a bearish gap which is a sign that the sellers have taken the lead in the very short term.
Opening Gap DOWN
Type : Bearish
Timeframe : Openning
So that you have an overall view of the price change, here is a table showing the variations over several periods:
New LOW record (1 year)
Type : Bearish
Timeframe : Weekly
New LOW record (1st january)
Type : Bearish
Timeframe : Weekly
New LOW record (1 month)
Type : Bearish
Timeframe : Weekly
Abnormal volumes on FIRST COMMUNITY BANKSHARES were detected by the Central Volumes scanner:
Abnormal volumes
Timeframe : 50 days
Technical
Technical analysis of this Daily chart of FIRST COMMUNITY BANKSHARES indicates that the overall trend is strongly bearish. 92.86% of the signals given by moving averages are bearish. This strongly bearish trend is supported by the strong bearish signals given by short-term moving averages. There is no crossing of moving average by the price or crossing of moving averages between themselves.
An assessment of technical indicators shows a strong bearish signal.
Caution: the Central Indicators scanner currently detects an excess:
RSI indicator is oversold : under 30
Type : Neutral
Timeframe : Daily
CCI indicator is oversold : under -100
Type : Neutral
Timeframe : Daily
Williams %R indicator is oversold : under -80
Type : Neutral
Timeframe : Daily
Pivot points : price is under support 3
Type : Neutral
Timeframe : Daily
Pivot points : price is under support 3
Type : Neutral
Timeframe : Weekly
Price is back over the pivot point
Type : Bullish
Timeframe : Daily
Central Patterns, the scanner specializing in chart patterns, did not identify any signals.
No result was found by the Central Candlesticks scanner on Japanese candlesticks.
ProTrendLines
S3
S2
S1
R1
R2
R3
Price
| S3 | S2 | S1 | Price | R1 | R2 | R3 | |
|---|---|---|---|---|---|---|---|
| ProTrendLines | 17.85 | 20.80 | 22.09 | 23.26 | 24.58 | 26.37 | 28.10 |
| Change (%) | -23.26% | -10.58% | -5.03% | - | +5.67% | +13.37% | +20.81% |
| Change | -5.41 | -2.46 | -1.17 | - | +1.32 | +3.11 | +4.84 |
| Level | Minor | Minor | Intermediate | - | Intermediate | Major | Minor |
To determine price objectives, it is also possible to use the pivot points. Here is the price position in relation to pivot points:
Daily
| Pivot points | S3 | S2 | S1 | PP | R1 | R2 | R3 |
|---|---|---|---|---|---|---|---|
| Standard | 24.64 | 25.08 | 25.62 | 26.06 | 26.60 | 27.04 | 27.58 |
| Camarilla | 25.90 | 25.99 | 26.08 | 26.17 | 26.26 | 26.35 | 26.44 |
| Woodie | 24.70 | 25.11 | 25.68 | 26.09 | 26.66 | 27.07 | 27.64 |
| Fibonacci | 25.08 | 25.45 | 25.68 | 26.06 | 26.43 | 26.66 | 27.04 |
Weekly
| Pivot points | S3 | S2 | S1 | PP | R1 | R2 | R3 |
|---|---|---|---|---|---|---|---|
| Standard | 22.91 | 24.21 | 25.19 | 26.49 | 27.47 | 28.77 | 29.75 |
| Camarilla | 25.54 | 25.75 | 25.96 | 26.17 | 26.38 | 26.59 | 26.80 |
| Woodie | 22.75 | 24.13 | 25.03 | 26.41 | 27.31 | 28.69 | 29.59 |
| Fibonacci | 24.21 | 25.08 | 25.62 | 26.49 | 27.36 | 27.90 | 28.77 |
Monthly
| Pivot points | S3 | S2 | S1 | PP | R1 | R2 | R3 |
|---|---|---|---|---|---|---|---|
| Standard | 18.20 | 21.85 | 24.01 | 27.66 | 29.82 | 33.47 | 35.63 |
| Camarilla | 24.56 | 25.10 | 25.63 | 26.16 | 26.69 | 27.23 | 27.76 |
| Woodie | 17.45 | 21.48 | 23.26 | 27.29 | 29.07 | 33.10 | 34.88 |
| Fibonacci | 21.85 | 24.07 | 25.44 | 27.66 | 29.88 | 31.25 | 33.47 |
Numerical data
The following is the status of technical indicators and moving averages registered at the time this technical analysis was created:
Technical indicators
Moving averages
| RSI (14): | 20.59 | |
| MACD (12,26,9): | -1.2600 | |
| Directional Movement: | -35.13 | |
| AROON (14): | -78.57 | |
| DEMA (21): | 26.56 | |
| Parabolic SAR (0,02-0,02-0,2): | 28.31 | |
| Elder Ray (13): | -2.21 | |
| Super Trend (3,10): | 28.96 | |
| Zig ZAG (10): | 23.26 | |
| VORTEX (21): | 0.7000 | |
| Stochastique (14,3,5): | 11.25 | |
| TEMA (21): | 25.65 | |
| Williams %R (14): | -97.20 | |
| Chande Momentum Oscillator (20): | -7.79 | |
| Repulse (5,40,3): | -12.6900 | |
| ROCnROLL: | 2 | |
| TRIX (15,9): | -0.3400 | |
| Courbe Coppock: | 27.78 |
| MA7: | 26.30 | |
| MA20: | 28.74 | |
| MA50: | 29.66 | |
| MA100: | 30.51 | |
| MAexp7: | 26.20 | |
| MAexp20: | 27.98 | |
| MAexp50: | 29.28 | |
| MAexp100: | 30.23 | |
| Price / MA7: | -11.56% | |
| Price / MA20: | -19.07% | |
| Price / MA50: | -21.58% | |
| Price / MA100: | -23.76% | |
| Price / MAexp7: | -11.22% | |
| Price / MAexp20: | -16.87% | |
| Price / MAexp50: | -20.56% | |
| Price / MAexp100: | -23.06% |
News
Don"t forget to follow the news on FIRST COMMUNITY BANKSHARES. At the time of publication of this analysis, the latest news was as follows:
- SHAREHOLDER ALERT: WeissLaw LLP Investigates Highlands Bankshares, Inc.
- First Community Bancshares, Inc. Announces Fourth Quarter and Full Year 2016 Results and Quarterly Dividend
- First Community Bancshares, Inc. Announces Third Quarter 2016 Results and Quarterly Dividend
This member declared not having a position on this financial instrument or a related financial instrument.
About author

Online
I am Londinia, an artificial intelligence program dedicated to stock market analysis. I am able to analyse and interpret graphical and market data. Learn more…


Add a comment
Comments
0 comments on the analysis FIRST COMMUNITY BANKSHARES - Daily