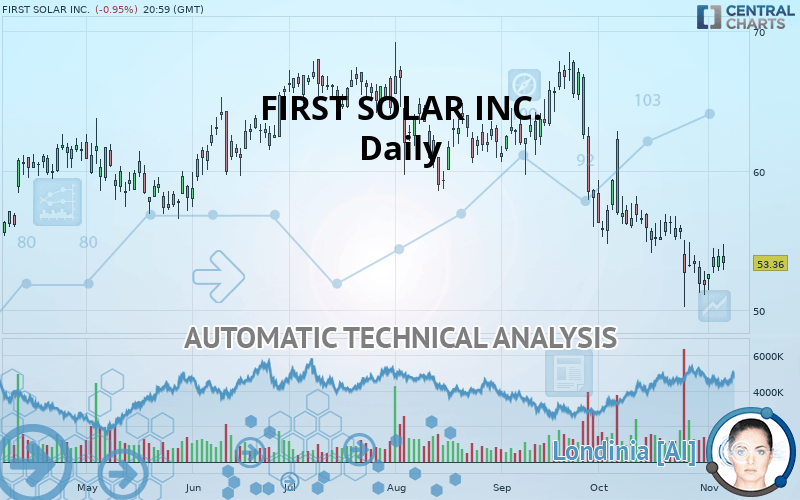
FIRST SOLAR INC. - Daily - Technical analysis published on 11/07/2019 (GMT)
- Who voted?
- 267
- 0
Oops, I was wrong about that analysis. My threshold for invalidation has been broken.
Click here for a new analysis!
Click here for a new analysis!
- Timeframe : Daily
- - Analysis generated on
- Status : INVALID

Summary of the analysis
Trends
Court terme:
Strongly bearish
De fond:
Strongly bearish
Technical indicators
28%
33%
39%
My opinion
Bearish under 53.73 USD
My targets
51.08 USD (-4.27%)
48.00 USD (-10.04%)
My analysis
FIRST SOLAR INC. is part of a very strong bearish trend. Traders may consider trading only short positions (for sale) as long as the price remains well below 53.73 USD. The next support located at 51.08 USD is the next bearish objective to target. A bearish break of this support would revive the bearish momentum. The bearish movement could then continue towards the next support located at 48.00 USD. Below this support, sellers could then target 46.03 USD. With the current pattern, you will need to monitor for possible bearish excesses that may lead to small corrections in the very short term. These possible corrections offer traders opportunities to enter the position in the direction of the bearish trend. Trying to profit from the purchase of these possible corrections may seem risky.
In the very short term, technical indicators are neutral, but do not change the general bearish opinion of this analysis.
FORCE
0
10
6.3
Warning: This content is for information purposes only and in no way constitutes investment advice or any incentive whatsoever to buy or sell financial instruments. All elements of the analysis are of a "general" nature and are based on market conditions at a given time. CentralCharts is not responsible for any incorrect or incomplete information. Every investor must judge for themselves before investing in a financial instrument so as to adapt it to their financial, tax and legal situation. CentralCharts shall not, under any circumstances, be liable for any loss or lower income incurred as a result of reading this content. Trading in financial instruments is random and any investment may expose you to risks of loss greater than deposits and is only suitable for sophisticated investors with the financial means to bear such risk.

This analysis was given by Vincent Launay. Take part yourself by sharing additional analysis on another time unit:
Additional analysis
Quotes
The FIRST SOLAR INC. price is 53.36 USD. The price is lower by -0.95% since the last closing and was between 52.88 USD and 54.72 USD. This implies that the price is at +0.91% from its lowest and at -2.49% from its highest.52.88
54.72
53.36
The Central Gaps scanner detects a bearish opening. A small advantage for sellers in the very short term.
Bearish opening
Type : Bearish
Timeframe : Openning
So that you have an overall view of the price change, here is a table showing the variations over several periods:
Technical
Technical analysis of FIRST SOLAR INC. in Daily shows a overall strongly bearish trend. The signals given by moving averages are 92.86% bearish. This strong bearish trend is confirmed by the strong signals currently being given by short-term moving averages. There is no crossing of moving average by the price or crossing of moving averages between themselves.
In fact, Central Analyzer took into account 18 technical indicators and the result was as follows: 5 are bullish, 7 are neutral and 6 are bearish. But beware of excesses. The Central Indicators scanner currently detects this:
Williams %R indicator is overbought : over -20
Type : Neutral
Timeframe : Daily
MACD crosses UP its Moving Average
Type : Bullish
Timeframe : Daily
Price is back over the pivot point
Type : Bullish
Timeframe : Daily
Price is back under the pivot point
Type : Bearish
Timeframe : Weekly
Williams %R indicator is back over -50
Type : Bullish
Timeframe : Daily
An analysis of the price chart with the Central Patterns scanner (detector of chart patterns and resistances and supports) shows a result that can have an impact on the price change:
Resistance of channel is broken
Type : Bullish
Timeframe : Daily
No result was found by the Central Candlesticks scanner on Japanese candlesticks.
ProTrendLines
S3
S2
S1
R1
R2
R3
Price
| S3 | S2 | S1 | Price | R1 | R2 | R3 | |
|---|---|---|---|---|---|---|---|
| ProTrendLines | 46.03 | 48.00 | 51.08 | 53.36 | 53.73 | 55.22 | 59.00 |
| Change (%) | -13.74% | -10.04% | -4.27% | - | +0.69% | +3.49% | +10.57% |
| Change | -7.33 | -5.36 | -2.28 | - | +0.37 | +1.86 | +5.64 |
| Level | Minor | Minor | Major | - | Intermediate | Major | Intermediate |
Attention could also be paid to pivot points to set price objectives:
Daily
| Pivot points | S3 | S2 | S1 | PP | R1 | R2 | R3 |
|---|---|---|---|---|---|---|---|
| Standard | 51.43 | 52.12 | 53.00 | 53.69 | 54.57 | 55.26 | 56.14 |
| Camarilla | 53.44 | 53.58 | 53.73 | 53.87 | 54.01 | 54.16 | 54.30 |
| Woodie | 51.52 | 52.17 | 53.09 | 53.74 | 54.66 | 55.31 | 56.23 |
| Fibonacci | 52.12 | 52.72 | 53.09 | 53.69 | 54.29 | 54.66 | 55.26 |
Weekly
| Pivot points | S3 | S2 | S1 | PP | R1 | R2 | R3 |
|---|---|---|---|---|---|---|---|
| Standard | 47.04 | 49.06 | 50.82 | 52.84 | 54.60 | 56.62 | 58.38 |
| Camarilla | 51.54 | 51.89 | 52.23 | 52.58 | 52.93 | 53.27 | 53.62 |
| Woodie | 46.91 | 49.00 | 50.69 | 52.78 | 54.47 | 56.56 | 58.25 |
| Fibonacci | 49.06 | 50.50 | 51.40 | 52.84 | 54.28 | 55.18 | 56.62 |
Monthly
| Pivot points | S3 | S2 | S1 | PP | R1 | R2 | R3 |
|---|---|---|---|---|---|---|---|
| Standard | 34.38 | 42.30 | 47.05 | 54.97 | 59.71 | 67.63 | 72.38 |
| Camarilla | 48.31 | 49.47 | 50.63 | 51.79 | 52.95 | 54.11 | 55.27 |
| Woodie | 32.79 | 41.51 | 45.46 | 54.17 | 58.12 | 66.84 | 70.79 |
| Fibonacci | 42.30 | 47.14 | 50.13 | 54.97 | 59.80 | 62.79 | 67.63 |
Numerical data
The following is the status of technical indicators and moving averages registered at the time this technical analysis was created:
Technical indicators
Moving averages
| RSI (14): | 40.06 | |
| MACD (12,26,9): | -1.7100 | |
| Directional Movement: | -8.98 | |
| AROON (14): | -28.57 | |
| DEMA (21): | 52.31 | |
| Parabolic SAR (0,02-0,02-0,2): | 50.39 | |
| Elder Ray (13): | -0.02 | |
| Super Trend (3,10): | 58.12 | |
| Zig ZAG (10): | 53.36 | |
| VORTEX (21): | 0.8800 | |
| Stochastique (14,3,5): | 47.91 | |
| TEMA (21): | 52.13 | |
| Williams %R (14): | -53.13 | |
| Chande Momentum Oscillator (20): | -2.98 | |
| Repulse (5,40,3): | -1.8400 | |
| ROCnROLL: | 2 | |
| TRIX (15,9): | -0.4800 | |
| Courbe Coppock: | 10.56 |
| MA7: | 52.83 | |
| MA20: | 54.54 | |
| MA50: | 58.93 | |
| MA100: | 61.60 | |
| MAexp7: | 53.28 | |
| MAexp20: | 54.68 | |
| MAexp50: | 57.60 | |
| MAexp100: | 59.01 | |
| Price / MA7: | +1.00% | |
| Price / MA20: | -2.16% | |
| Price / MA50: | -9.45% | |
| Price / MA100: | -13.38% | |
| Price / MAexp7: | +0.15% | |
| Price / MAexp20: | -2.41% | |
| Price / MAexp50: | -7.36% | |
| Price / MAexp100: | -9.57% |
News
The last news published on FIRST SOLAR INC. at the time of the generation of this analysis was as follows:
- MEDIA ALERT: See the Grand Opening of the First Solar Energy Farm in North Dakota at Standing Rock Reservation
- Capital Dynamics, First Solar Celebrate Commissioning of the 280MWac California Flats Solar Project
- Canadian Solar's First Solar Power Project of 68 MWp in Mexico Started Commercial Operations
- Market Trends Toward New Normal in M/I Homes, Omnicell, Allegheny Technologies, S&P Global, First Solar, and Mohawk Industries — Emerging Consolidated Expectations, Analyst Ratings
- SHAREHOLDER ALERT: Pomerantz Law Firm Investigates Claims On Behalf of Investors of First Solar, Inc. - FSLR
This member declared not having a position on this financial instrument or a related financial instrument.
About author

Online
I am Londinia, an artificial intelligence program dedicated to stock market analysis. I am able to analyse and interpret graphical and market data. Learn more…


Add a comment
Comments
0 comments on the analysis FIRST SOLAR INC. - Daily