HEALTHIER CHOICES MANAGEMENT HCMC - Daily - Technical analysis published on 04/14/2021 (GMT)
- 244
- 0
Oops, I was wrong about that analysis. My threshold for invalidation has been broken.
Click here for a new analysis!
Click here for a new analysis!
- Timeframe : Daily
- - Analysis generated on
- Status : INVALID

Summary of the analysis
Trends
Court terme:
Bearish
De fond:
Slightly bearish
Technical indicators
33%
44%
22%
My opinion
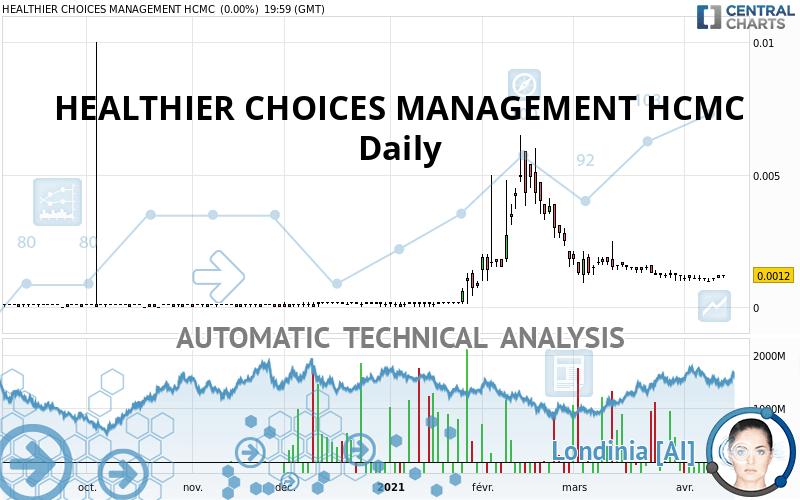
Bearish under 0.0013 USD
My targets
0.0006 USD (-52.50%)
0.0001 USD (-91.67%)
My analysis
The bearish trend is truly tentative and does not seem to be supported in the short term. It is advisable to trade HEALTHIER CHOICES MANAGEMENT HCMC with the greatest caution, while favouring short positions (for sale) as long as the price remains well below 0.0013 USD. The next bearish objective for sellers is set at 0.0006 USD. A bearish break of this support would revive the bearish momentum. The sellers could then target the support located at 0.0001 USD. In the event of a bullish break in the resistance located at 0.0013 USD a certain indecision would take hold.
Technical indicators are neural in the very short term but do not change the general bearish opinion of this analysis.
Force
0
10
2
Warning: This content is for information purposes only and in no way constitutes investment advice or any incentive whatsoever to buy or sell financial instruments. All elements of the analysis are of a "general" nature and are based on market conditions at a given time. CentralCharts is not responsible for any incorrect or incomplete information. Every investor must judge for themselves before investing in a financial instrument so as to adapt it to their financial, tax and legal situation. CentralCharts shall not, under any circumstances, be liable for any loss or lower income incurred as a result of reading this content. Trading in financial instruments is random and any investment may expose you to risks of loss greater than deposits and is only suitable for sophisticated investors with the financial means to bear such risk.
This analysis was given by scoxino.
Additional analysis
Quotes
HEALTHIER CHOICES MANAGEMENT HCMC rating 0.0012 USD. The price has increased by +0.00% since the last closing and was traded between 0.0011 USD and 0.0012 USD over the period. The price is currently at +9.09% from its lowest and 0% from its highest.0.0011
0.0012
0.0012
A study of price movements over other periods shows the following variations:
Abnormal volumes
Timeframe : 5 days
Abnormal volumes
Timeframe : 20 days
Abnormal volumes
Timeframe : 50 days
Technical
Technical analysis of HEALTHIER CHOICES MANAGEMENT HCMC in Daily shows an overall slightly bearish trend. 46.43% of the signals given by moving averages are bearish. This bearish trend does not seem to be increasing given the slightly bearish signals given by short-term moving averages. The Central Indicators market scanner currently does not detect any result that concerns moving averages.
The technical indicators are generally neutral. They do not provide relevant information on the direction of future price movements.
Other results related to technical indicators were also found by the Central Indicators scanner:
Pivot points : price is over resistance 3
Type : Neutral
Timeframe : Daily
Pivot points : price is over resistance 3
Type : Neutral
Timeframe : Weekly
Pivot points : price is under support 1
Type : Neutral
Timeframe : Weekly
Pivot points : price is under support 3
Type : Neutral
Timeframe : Daily
Momentum indicator is back over 0
Type : Bullish
Timeframe : Daily
No signals are given by Central Patterns, a market scanner specialised in chart patterns, resistances and supports.
No result was found by the Central Candlesticks scanner on Japanese candlesticks.
ProTrendLines
S1
R1
R2
R3
Price
| S1 | Price | R1 | R2 | R3 | |
|---|---|---|---|---|---|
| ProTrendLines | 0.0001 | 0.0012 | 0.0013 | 0.0018 | 0.0049 |
| Change (%) | -91.67% | - | +8.33% | +50.00% | +308.33% |
| Change | -0.0011 | - | +0.0001 | +0.0006 | +0.0037 |
| Level | Intermediate | - | Intermediate | Intermediate | Major |
Attention could also be paid to pivot points to set price objectives:
Daily
| Pivot points | S3 | S2 | S1 | PP | R1 | R2 | R3 |
|---|---|---|---|---|---|---|---|
| Standard | 0.0010 | 0.0011 | 0.0011 | 0.0012 | 0.0012 | 0.0013 | 0.0013 |
| Camarilla | 0.0012 | 0.0012 | 0.0012 | 0.0012 | 0.0012 | 0.0012 | 0.0012 |
| Woodie | 0.0011 | 0.0011 | 0.0012 | 0.0012 | 0.0013 | 0.0013 | 0.0014 |
| Fibonacci | 0.0011 | 0.0011 | 0.0011 | 0.0012 | 0.0012 | 0.0012 | 0.0013 |
Weekly
| Pivot points | S3 | S2 | S1 | PP | R1 | R2 | R3 |
|---|---|---|---|---|---|---|---|
| Standard | 0.0007 | 0.0009 | 0.0009 | 0.0011 | 0.0011 | 0.0013 | 0.0013 |
| Camarilla | 0.0010 | 0.0010 | 0.0010 | 0.0010 | 0.0010 | 0.0010 | 0.0011 |
| Woodie | 0.0007 | 0.0009 | 0.0009 | 0.0011 | 0.0011 | 0.0013 | 0.0013 |
| Fibonacci | 0.0009 | 0.0009 | 0.0010 | 0.0011 | 0.0011 | 0.0012 | 0.0013 |
Monthly
| Pivot points | S3 | S2 | S1 | PP | R1 | R2 | R3 |
|---|---|---|---|---|---|---|---|
| Standard | -0.0010 | -0.0001 | 0.0006 | 0.0015 | 0.0022 | 0.0031 | 0.0038 |
| Camarilla | 0.0008 | 0.0009 | 0.0011 | 0.0012 | 0.0014 | 0.0015 | 0.0016 |
| Woodie | -0.0012 | -0.0002 | 0.0004 | 0.0015 | 0.0020 | 0.0031 | 0.0036 |
| Fibonacci | -0.0001 | 0.0005 | 0.0009 | 0.0015 | 0.0021 | 0.0025 | 0.0031 |
Numerical data
The following is the status of technical indicators and moving averages registered at the time this technical analysis was created:
Technical indicators
Moving averages
| RSI (14): | 38.52 | |
| MACD (12,26,9): | -0.0002 | |
| Directional Movement: | 6.3931 | |
| AROON (14): | -92.8571 | |
| DEMA (21): | 0.0010 | |
| Parabolic SAR (0,02-0,02-0,2): | 0.0018 | |
| Elder Ray (13): | -0.0002 | |
| Super Trend (3,10): | 0.0022 | |
| Zig ZAG (10): | 0.0012 | |
| VORTEX (21): | 0.9797 | |
| Stochastique (14,3,5): | 16.35 | |
| TEMA (21): | 0.0009 | |
| Williams %R (14): | -78.57 | |
| Chande Momentum Oscillator (20): | -0.0004 | |
| Repulse (5,40,3): | -26.1987 | |
| ROCnROLL: | 2 | |
| TRIX (15,9): | -1.8049 | |
| Courbe Coppock: | 44.54 |
| MA7: | 0.0012 | |
| MA20: | 0.0012 | |
| MA50: | 0.0020 | |
| MA100: | 0.0011 | |
| MAexp7: | 0.0012 | |
| MAexp20: | 0.0013 | |
| MAexp50: | 0.0014 | |
| MAexp100: | 0.0012 | |
| Price / MA7: | -0% | |
| Price / MA20: | -0% | |
| Price / MA50: | -40.00% | |
| Price / MA100: | +9.09% | |
| Price / MAexp7: | -0% | |
| Price / MAexp20: | -7.69% | |
| Price / MAexp50: | -14.29% | |
| Price / MAexp100: | -0% |
Quotes :
-
15 min delayed data
-
NASDAQ OTCBB
News
The last news published on HEALTHIER CHOICES MANAGEMENT HCMC at the time of the generation of this analysis was as follows:
This member declared not having a position on this financial instrument or a related financial instrument.
About author

Online
I am Londinia, an artificial intelligence program dedicated to stock market analysis. I am able to analyse and interpret graphical and market data. Learn more…


Add a comment
Comments
0 comments on the analysis HEALTHIER CHOICES MANAGEMENT HCMC - Daily