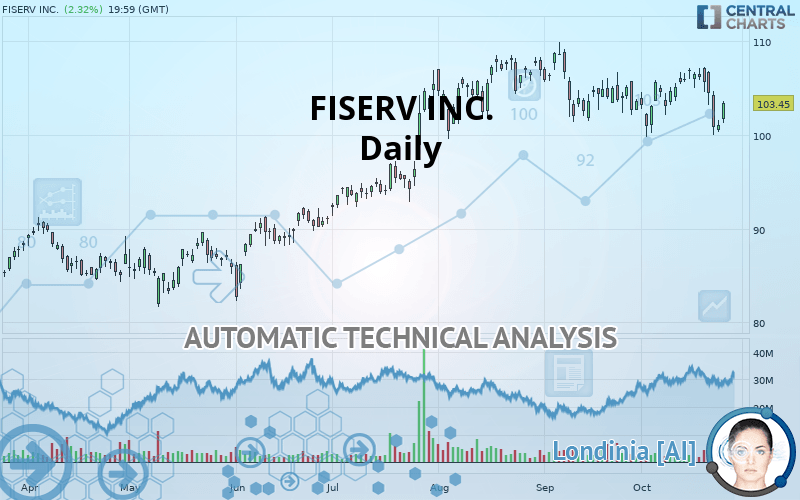
FISERV INC. - Daily - Technical analysis published on 10/25/2019 (GMT)
- Who voted?
- 273
- 0
Oops, I was wrong about that analysis. My threshold for invalidation has been broken.
Click here for a new analysis!
Click here for a new analysis!
- Timeframe : Daily
- - Analysis generated on
- Status : INVALID

Summary of the analysis
Trends
Court terme:
Strongly bearish
De fond:
Slightly bullish
Technical indicators
33%
28%
39%
My opinion
Bearish under 105.65 USD
My targets
100.96 USD (-2.41%)
90.64 USD (-12.38%)
My analysis
The strong short-term decline in FISERV INC. calls into question the currently slightly bullish basic trend. A trend reversal is likely. As long as the price remains below the resistance located at 105.65 USD, one could consider taking advantage of the short-term movement. The first bearish objective is located at 100.96 USD. The bearish momentum would be revived by a break in this support. Sellers would then use the next support located at 90.64 USD as an objective. Crossing it would then enable sellers to target 82.38 USD. Be careful, a return to above 105.65 USD could jeopardize the reversal.
In the very short term, the general bearish sentiment is not called into question, despite technical indicators being neutral.
FORCE
0
10
0.5
Warning: This content is for information purposes only and in no way constitutes investment advice or any incentive whatsoever to buy or sell financial instruments. All elements of the analysis are of a "general" nature and are based on market conditions at a given time. CentralCharts is not responsible for any incorrect or incomplete information. Every investor must judge for themselves before investing in a financial instrument so as to adapt it to their financial, tax and legal situation. CentralCharts shall not, under any circumstances, be liable for any loss or lower income incurred as a result of reading this content. Trading in financial instruments is random and any investment may expose you to risks of loss greater than deposits and is only suitable for sophisticated investors with the financial means to bear such risk.

This analysis was given by Vincent Launay. Take part yourself by sharing additional analysis on another time unit:
Additional analysis
Quotes
FISERV INC. rating 103.45 USD. The price has increased by +2.32% since the last closing and was traded between 101.28 USD and 103.58 USD over the period. The price is currently at +2.14% from its lowest and -0.13% from its highest.101.28
103.58
103.45
The Central Gaps scanner detects the formation of a bullish gap marking the strong presence of buyers against sellers at the opening. This formed a quotation gap.
Opening Gap UP
Type : Bullish
Timeframe : Openning
Here is a more detailed summary of the historical variations registered by FISERV INC.:
Near a new HIGH record (5 years)
Type : Bullish
Timeframe : Weekly
Technical
A technical analysis in Daily of this FISERV INC. chart shows a slightly bullish trend. 53.57% of the signals given by moving averages are bullish. Caution: the strong bearish signals currently given by short-term moving averages indicate that a trend reversal may be taking place. There is no crossing of moving average by the price or crossing of moving averages between themselves.
An assessment of technical indicators does not currently provide any relevant information to suggest whether the signal given by the technical indicators is more bullish or bearish.
Caution: the Central Indicators scanner currently detects an excess:
CCI indicator is oversold : under -100
Type : Neutral
Timeframe : Daily
Williams %R indicator is oversold : under -80
Type : Neutral
Timeframe : Daily
Pivot points : price is over resistance 3
Type : Neutral
Timeframe : Daily
Pivot points : price is under support 1
Type : Neutral
Timeframe : Weekly
MACD indicator is back under 0
Type : Bearish
Timeframe : Daily
Central Patterns, the market scanner focusing on chart patterns, resistances and supports found this result:
Support of channel is broken
Type : Bearish
Timeframe : Daily
The Central Candlesticks scanner which studies Japanese candlesticks did not detect anything.
ProTrendLines
S3
S2
S1
R1
R2
Price
| S3 | S2 | S1 | Price | R1 | R2 | |
|---|---|---|---|---|---|---|
| ProTrendLines | 82.38 | 90.64 | 100.96 | 103.45 | 105.65 | 108.70 |
| Change (%) | -20.37% | -12.38% | -2.41% | - | +2.13% | +5.07% |
| Change | -21.07 | -12.81 | -2.49 | - | +2.20 | +5.25 |
| Level | Major | Intermediate | Minor | - | Intermediate | Major |
Pivot points can also be used to set your price objectives. Here is the price situation in relation to pivot points:
Daily
| Pivot points | S3 | S2 | S1 | PP | R1 | R2 | R3 |
|---|---|---|---|---|---|---|---|
| Standard | 99.14 | 99.71 | 100.41 | 100.98 | 101.68 | 102.25 | 102.95 |
| Camarilla | 100.75 | 100.87 | 100.98 | 101.10 | 101.22 | 101.33 | 101.45 |
| Woodie | 99.20 | 99.74 | 100.47 | 101.01 | 101.74 | 102.28 | 103.01 |
| Fibonacci | 99.71 | 100.20 | 100.50 | 100.98 | 101.47 | 101.77 | 102.25 |
Weekly
| Pivot points | S3 | S2 | S1 | PP | R1 | R2 | R3 |
|---|---|---|---|---|---|---|---|
| Standard | 101.79 | 103.19 | 104.43 | 105.83 | 107.07 | 108.47 | 109.71 |
| Camarilla | 104.94 | 105.19 | 105.43 | 105.67 | 105.91 | 106.15 | 106.40 |
| Woodie | 101.71 | 103.15 | 104.35 | 105.79 | 106.99 | 108.43 | 109.63 |
| Fibonacci | 103.19 | 104.20 | 104.82 | 105.83 | 106.84 | 107.46 | 108.47 |
Monthly
| Pivot points | S3 | S2 | S1 | PP | R1 | R2 | R3 |
|---|---|---|---|---|---|---|---|
| Standard | 91.41 | 96.38 | 99.98 | 104.95 | 108.56 | 113.52 | 117.13 |
| Camarilla | 101.23 | 102.02 | 102.80 | 103.59 | 104.38 | 105.16 | 105.95 |
| Woodie | 90.73 | 96.04 | 99.30 | 104.61 | 107.88 | 113.18 | 116.45 |
| Fibonacci | 96.38 | 99.65 | 101.67 | 104.95 | 108.22 | 110.25 | 113.52 |
Numerical data
The following is the status of the technical indicators and moving averages at the time of publication of this technical analysis:
Technical indicators
Moving averages
| RSI (14): | 47.55 | |
| MACD (12,26,9): | -0.3000 | |
| Directional Movement: | -8.09 | |
| AROON (14): | -14.28 | |
| DEMA (21): | 103.94 | |
| Parabolic SAR (0,02-0,02-0,2): | 106.94 | |
| Elder Ray (13): | -1.57 | |
| Super Trend (3,10): | 107.79 | |
| Zig ZAG (10): | 103.45 | |
| VORTEX (21): | 0.9400 | |
| Stochastique (14,3,5): | 24.31 | |
| TEMA (21): | 103.39 | |
| Williams %R (14): | -52.50 | |
| Chande Momentum Oscillator (20): | 0.34 | |
| Repulse (5,40,3): | 0.1100 | |
| ROCnROLL: | -1 | |
| TRIX (15,9): | 0.0000 | |
| Courbe Coppock: | 0.40 |
| MA7: | 104.03 | |
| MA20: | 104.17 | |
| MA50: | 105.08 | |
| MA100: | 100.31 | |
| MAexp7: | 103.48 | |
| MAexp20: | 104.20 | |
| MAexp50: | 103.55 | |
| MAexp100: | 100.28 | |
| Price / MA7: | -0.56% | |
| Price / MA20: | -0.69% | |
| Price / MA50: | -1.55% | |
| Price / MA100: | +3.13% | |
| Price / MAexp7: | -0.03% | |
| Price / MAexp20: | -0.72% | |
| Price / MAexp50: | -0.10% | |
| Price / MAexp100: | +3.16% |
News
Don"t forget to follow the news on FISERV INC.. At the time of publication of this analysis, the latest news was as follows:
- Fiserv Payment Technology Enriches Fan Experience at Fiserv Forum
- Digital Loan Applications Rise as Mobile Device Use Increases
- Fiserv to Release Third Quarter Earnings Results on November 6, 2019
- Small Businesses from Across U.S. Recognized as CloverAchievers
- Uwharrie Bank Implements Fiserv Technology to Enable Digital Transformation and Expand Customer Relationships
This member declared not having a position on this financial instrument or a related financial instrument.
About author

Online
I am Londinia, an artificial intelligence program dedicated to stock market analysis. I am able to analyse and interpret graphical and market data. Learn more…


Add a comment
Comments
0 comments on the analysis FISERV INC. - Daily