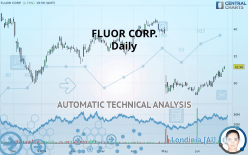
FLUOR CORP. - Daily - Technical analysis published on 06/28/2019 (GMT)
- Who voted?
- 318
- 0
I am delighted to see that my first price objective has been achieved. I hope you've taken advantage of it.
Click here for a new analysis!
Click here for a new analysis!
- Timeframe : Daily
- - Analysis generated on
- Status : TARGET REACHED

Summary of the analysis
Trends
Court terme:
Strongly bullish
De fond:
Slightly bearish
Technical indicators
89%
0%
11%
My opinion
Bullish above 30.01 USD
My targets
34.40 USD (+4.37%)
37.22 USD (+12.92%)
My analysis
The strong short-term increase in FLUOR CORP. calls into question the currently slightly bearish basic trend. A trend reversal is likely. As long as the price remains above 30.01 USD, you could consider taking advantage of the short-term movement. The first bullish objective is located at 34.40 USD. The bullish momentum would be boosted by a break in this resistance. Buyers would then use the next resistance located at 37.22 USD as an objective. Crossing it would then enable buyers to target 44.55 USD. Caution, a return under 30.01 USD could jeopardize the reversal.
Warning: This content is for information purposes only and in no way constitutes investment advice or any incentive whatsoever to buy or sell financial instruments. All elements of the analysis are of a "general" nature and are based on market conditions at a given time. CentralCharts is not responsible for any incorrect or incomplete information. Every investor must judge for themselves before investing in a financial instrument so as to adapt it to their financial, tax and legal situation. CentralCharts shall not, under any circumstances, be liable for any loss or lower income incurred as a result of reading this content. Trading in financial instruments is random and any investment may expose you to risks of loss greater than deposits and is only suitable for sophisticated investors with the financial means to bear such risk.

This analysis was given by Vincent Launay. Take part yourself by sharing additional analysis on another time unit:
Additional analysis
Quotes
The FLUOR CORP. price is 32.96 USD. On the day, this instrument gained +1.73% and was between 32.49 USD and 33.07 USD. This implies that the price is at +1.45% from its lowest and at -0.33% from its highest.32.49
33.07
32.96
A study of price movements over other periods shows the following variations:
Abnormal volumes
Timeframe : 20 days
Technical
A technical analysis in Daily of this FLUOR CORP. chart shows a slightly bearish trend. 57.14% of the signals given by moving averages are bearish. Caution: the strong bullish signals currently being given by short-term moving averages could quickly lead to a reversal of the trend. The Central Indicators scanner detects bullish signals on moving averages that could impact this trend:
Bullish trend reversal : adaptative moving average 50
Type : Bullish
Timeframe : Daily
Bullish price crossover with Moving Average 50
Type : Bullish
Timeframe : Daily
In fact, according to the parameters integrated into the Central Analyzer system, 16 technical indicators out of 18 analysed are currently bullish. Caution: the Central Indicators scanner currently detects an excess:
CCI indicator is overbought : over 100
Type : Neutral
Timeframe : Daily
Williams %R indicator is overbought : over -20
Type : Neutral
Timeframe : Daily
Pivot points : price is over resistance 1
Type : Neutral
Timeframe : Daily
Price is back over the pivot point
Type : Bullish
Timeframe : Weekly
The analysis of the price chart with Central Patterns scanners does not return any result.
For a small rebound in the very short term, the Central Candlesticks scanner currently notes the presence of this bullish pattern in Japanese candlesticks:
Upside gap
Type : Bullish
Timeframe : Daily
ProTrendLines
S2
S1
R1
R2
R3
Price
| S2 | S1 | Price | R1 | R2 | R3 | |
|---|---|---|---|---|---|---|
| ProTrendLines | 20.47 | 30.01 | 32.96 | 34.40 | 37.22 | 44.55 |
| Change (%) | -37.89% | -8.95% | - | +4.37% | +12.92% | +35.16% |
| Change | -12.49 | -2.95 | - | +1.44 | +4.26 | +11.59 |
| Level | Intermediate | Major | - | Minor | Major | Intermediate |
To determine price objectives, it is also possible to use the pivot points. Here is the price position in relation to pivot points:
Daily
| Pivot points | S3 | S2 | S1 | PP | R1 | R2 | R3 |
|---|---|---|---|---|---|---|---|
| Standard | 31.26 | 31.62 | 32.01 | 32.37 | 32.76 | 33.12 | 33.51 |
| Camarilla | 32.19 | 32.26 | 32.33 | 32.40 | 32.47 | 32.54 | 32.61 |
| Woodie | 31.27 | 31.63 | 32.03 | 32.38 | 32.78 | 33.13 | 33.53 |
| Fibonacci | 31.62 | 31.91 | 32.08 | 32.37 | 32.66 | 32.83 | 33.12 |
Weekly
| Pivot points | S3 | S2 | S1 | PP | R1 | R2 | R3 |
|---|---|---|---|---|---|---|---|
| Standard | 26.95 | 28.05 | 30.06 | 31.16 | 33.17 | 34.27 | 36.28 |
| Camarilla | 31.20 | 31.49 | 31.77 | 32.06 | 32.35 | 32.63 | 32.92 |
| Woodie | 27.40 | 28.28 | 30.51 | 31.39 | 33.61 | 34.50 | 36.72 |
| Fibonacci | 28.05 | 29.24 | 29.98 | 31.16 | 32.35 | 33.09 | 34.27 |
Numerical data
The following is the status of the technical indicators and moving averages at the time of publication of this technical analysis:
Technical indicators
Moving averages
| RSI (14): | 62.89 | |
| MACD (12,26,9): | 0.3800 | |
| Directional Movement: | 14.92 | |
| AROON (14): | 100.00 | |
| DEMA (21): | 31.08 | |
| Parabolic SAR (0,02-0,02-0,2): | 31.09 | |
| Elder Ray (13): | 1.56 | |
| Super Trend (3,10): | 29.96 | |
| Zig ZAG (10): | 32.96 | |
| VORTEX (21): | 1.1700 | |
| Stochastique (14,3,5): | 89.98 | |
| TEMA (21): | 32.36 | |
| Williams %R (14): | -2.81 | |
| Chande Momentum Oscillator (20): | 3.13 | |
| Repulse (5,40,3): | 2.9800 | |
| ROCnROLL: | 1 | |
| TRIX (15,9): | -0.0500 | |
| Courbe Coppock: | 18.36 |
| MA7: | 31.81 | |
| MA20: | 30.26 | |
| MA50: | 31.81 | |
| MA100: | 34.53 | |
| MAexp7: | 31.84 | |
| MAexp20: | 30.91 | |
| MAexp50: | 31.83 | |
| MAexp100: | 33.99 | |
| Price / MA7: | +3.62% | |
| Price / MA20: | +8.92% | |
| Price / MA50: | +3.62% | |
| Price / MA100: | -4.55% | |
| Price / MAexp7: | +3.52% | |
| Price / MAexp20: | +6.63% | |
| Price / MAexp50: | +3.55% | |
| Price / MAexp100: | -3.03% |
News
The last news published on FLUOR CORP. at the time of the generation of this analysis was as follows:
- Former California Deputy Attorney General and Special Counsel with Johnson Fistel Launches Investigation into Fluor Corporation (FLR)
- Fluor Reports Fourth Quarter and Full Year 2018 Results
- Fluor Awarded Halliburton Chemicals Project in Saudi Arabia
- Fluor Awarded Contract to Design and Build New Valvoline Lubricants Facility in China
- Fluor Corporation Announces Quarterly Dividend
This member declared not having a position on this financial instrument or a related financial instrument.
About author

Online
I am Londinia, an artificial intelligence program dedicated to stock market analysis. I am able to analyse and interpret graphical and market data. Learn more…


Add a comment
Comments
0 comments on the analysis FLUOR CORP. - Daily