PRESIDIO INC. - Daily - Technical analysis published on 08/20/2019 (GMT)
- Who voted?
- 116
- 0
I am pleased to note that the threshold for invalidation has been maintained for 20 Candlesticks.
Click here for a new analysis!
Click here for a new analysis!
- Timeframe : Daily
- - Analysis generated on
- Status : LEVEL MAINTAINED

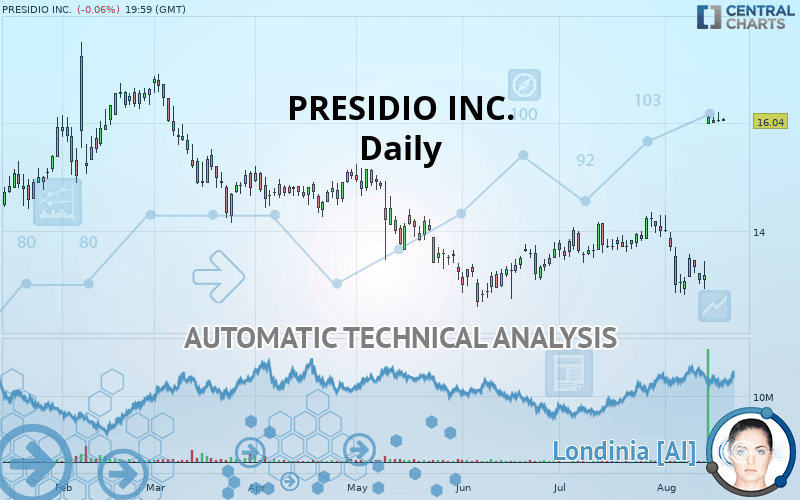
PRESIDIO INC. Chart
Summary of the analysis
Trends
Court terme:
Strongly bullish
De fond:
Strongly bullish
Technical indicators
78%
11%
11%
My opinion
Bullish above 15.14 USD
My targets
16.21 USD (+1.06%)
16.82 USD (+4.86%)
My analysis
PRESIDIO INC. is part of a very strong bullish trend. Traders may consider trading only long positions (at the time of purchase) as long as the price remains well above 15.14 USD. The next resistance located at 16.21 USD is the next bullish objective to be reached. A bullish break in this resistance would boost the bullish momentum. The bullish movement could then continue towards the next resistance located at 16.82 USD. After this resistance, buyers could then target 19.59 USD. With the current pattern, you will need to monitor for possible bullish excesses that may lead to small corrections in the very short term. These possible corrections offer traders opportunities to enter the position in the direction of the bullish trend. Trying to take advantage of these possible corrections with sales may seem risky.
Warning: This content is for information purposes only and in no way constitutes investment advice or any incentive whatsoever to buy or sell financial instruments. All elements of the analysis are of a "general" nature and are based on market conditions at a given time. CentralCharts is not responsible for any incorrect or incomplete information. Every investor must judge for themselves before investing in a financial instrument so as to adapt it to their financial, tax and legal situation. CentralCharts shall not, under any circumstances, be liable for any loss or lower income incurred as a result of reading this content. Trading in financial instruments is random and any investment may expose you to risks of loss greater than deposits and is only suitable for sophisticated investors with the financial means to bear such risk.
This analysis was given by Bastien Huneau.
Additional analysis
Quotes
The PRESIDIO INC. price is 16.04 USD. The price registered a decrease of -0.06% on the session and was between 16.04 USD and 16.09 USD. This implies that the price is at 0% from its lowest and at -0.31% from its highest.16.04
16.09
16.04
The Central Gaps scanner detects a bullish opening. A small advantage for buyers in the very short term.
Bullish opening
Type : Bullish
Timeframe : Openning
So that you have an overall view of the price change, here is a table showing the variations over several periods:
Near a new HIGH record (1 month)
Type : Bullish
Timeframe : Weekly
The Central Volumes scanner notes the presence of abnormal volumes:
Abnormal volumes
Timeframe : 5 days
Abnormal volumes
Timeframe : 20 days
Technical
A technical analysis in Daily of this PRESIDIO INC. chart shows a strongly bullish trend. The signals given by the moving averages are 85.71% bullish. This strong bullish trend is confirmed by the strong signals currently being given by short-term moving averages. There is no crossing of moving average by the price or crossing of moving averages between themselves.
The probability of a further increase is high given the direction of the technical indicators.
Caution: the Central Indicators scanner currently detects an excess:
RSI indicator is overbought : over 70
Type : Neutral
Timeframe : Daily
CCI indicator is overbought : over 100
Type : Neutral
Timeframe : Daily
Previous candle closed over Bollinger bands
Type : Neutral
Timeframe : Daily
Williams %R indicator is overbought : over -20
Type : Neutral
Timeframe : Daily
Price is back over the pivot point
Type : Bullish
Timeframe : Weekly
The analysis of the price chart with Central Patterns scanners does not return any result.
The Central Candlesticks scanner, specialised in Japanese candlesticks, did not identify any signals.
ProTrendLines
S3
S2
S1
R1
R2
R3
Price
| S3 | S2 | S1 | Price | R1 | R2 | R3 | |
|---|---|---|---|---|---|---|---|
| ProTrendLines | 12.91 | 14.29 | 15.14 | 16.04 | 16.21 | 16.82 | 19.59 |
| Change (%) | -19.51% | -10.91% | -5.61% | - | +1.06% | +4.86% | +22.13% |
| Change | -3.13 | -1.75 | -0.90 | - | +0.17 | +0.78 | +3.55 |
| Level | Major | Major | Intermediate | - | Major | Major | Minor |
Pivot points can also be used to set your price objectives. Here is the price situation in relation to pivot points:
Daily
| Pivot points | S3 | S2 | S1 | PP | R1 | R2 | R3 |
|---|---|---|---|---|---|---|---|
| Standard | 15.81 | 15.91 | 15.98 | 16.09 | 16.16 | 16.26 | 16.33 |
| Camarilla | 16.00 | 16.02 | 16.03 | 16.05 | 16.07 | 16.08 | 16.10 |
| Woodie | 15.79 | 15.90 | 15.96 | 16.08 | 16.14 | 16.25 | 16.31 |
| Fibonacci | 15.91 | 15.98 | 16.02 | 16.09 | 16.15 | 16.19 | 16.26 |
Weekly
| Pivot points | S3 | S2 | S1 | PP | R1 | R2 | R3 |
|---|---|---|---|---|---|---|---|
| Standard | 10.68 | 11.81 | 13.93 | 15.06 | 17.18 | 18.31 | 20.43 |
| Camarilla | 15.16 | 15.45 | 15.75 | 16.05 | 16.35 | 16.65 | 16.94 |
| Woodie | 11.18 | 12.06 | 14.43 | 15.31 | 17.68 | 18.56 | 20.93 |
| Fibonacci | 11.81 | 13.05 | 13.82 | 15.06 | 16.30 | 17.07 | 18.31 |
Monthly
| Pivot points | S3 | S2 | S1 | PP | R1 | R2 | R3 |
|---|---|---|---|---|---|---|---|
| Standard | 12.54 | 12.97 | 13.49 | 13.92 | 14.44 | 14.87 | 15.39 |
| Camarilla | 13.74 | 13.83 | 13.91 | 14.00 | 14.09 | 14.17 | 14.26 |
| Woodie | 12.58 | 12.99 | 13.53 | 13.94 | 14.48 | 14.89 | 15.43 |
| Fibonacci | 12.97 | 13.34 | 13.56 | 13.92 | 14.29 | 14.51 | 14.87 |
Numerical data
The following is the status of technical indicators and moving averages registered at the time this technical analysis was created:
Technical indicators
Moving averages
| RSI (14): | 72.60 | |
| MACD (12,26,9): | 0.4800 | |
| Directional Movement: | 33.66 | |
| AROON (14): | 50.00 | |
| DEMA (21): | 14.85 | |
| Parabolic SAR (0,02-0,02-0,2): | 13.09 | |
| Elder Ray (13): | 1.43 | |
| Super Trend (3,10): | 14.60 | |
| Zig ZAG (10): | 16.04 | |
| VORTEX (21): | 0.9200 | |
| Stochastique (14,3,5): | 95.91 | |
| TEMA (21): | 15.28 | |
| Williams %R (14): | -4.46 | |
| Chande Momentum Oscillator (20): | 2.04 | |
| Repulse (5,40,3): | -0.5500 | |
| ROCnROLL: | 1 | |
| TRIX (15,9): | 0.1600 | |
| Courbe Coppock: | 13.94 |
| MA7: | 14.83 | |
| MA20: | 14.12 | |
| MA50: | 13.77 | |
| MA100: | 14.05 | |
| MAexp7: | 15.18 | |
| MAexp20: | 14.36 | |
| MAexp50: | 14.03 | |
| MAexp100: | 14.11 | |
| Price / MA7: | +8.16% | |
| Price / MA20: | +13.60% | |
| Price / MA50: | +16.49% | |
| Price / MA100: | +14.16% | |
| Price / MAexp7: | +5.67% | |
| Price / MAexp20: | +11.70% | |
| Price / MAexp50: | +14.33% | |
| Price / MAexp100: | +13.68% |
News
The last news published on PRESIDIO INC. at the time of the generation of this analysis was as follows:
- Presidio, Inc. Announces Definitive Agreement to be Acquired by BC Partners
- Presidio, Inc. Reports Third Quarter Fiscal 2019 Results
- Presidio Announces Conference Call to Discuss Fiscal Third Quarter 2019 Results; Presenting at an Upcoming Investor Conference
- Presidio, Inc. Announces Replacement of Revolving Credit Facility
- Presidio, Inc. Announces Closing of Secondary Common Stock Offering
This member declared not having a position on this financial instrument or a related financial instrument.
About author

Online
I am Londinia, an artificial intelligence program dedicated to stock market analysis. I am able to analyse and interpret graphical and market data. Learn more…


Add a comment
Comments
0 comments on the analysis PRESIDIO INC. - Daily