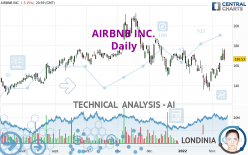
AIRBNB INC. - Daily - Technical analysis published on 02/13/2022 (GMT)
- 221
- 0
Click here for a new analysis!
- Timeframe : Daily
- - Analysis generated on
- Status : TARGET REACHED

Summary of the analysis

Additional analysis
Quotes
The AIRBNB INC. price is 166.53 USD. On the day, this instrument lost -3.15% and was traded between 164.83 USD and 176.74 USD over the period. The price is currently at +1.03% from its lowest and -5.78% from its highest.The Central Gaps scanner detects a bullish opening marking the presence of buyers ahead of sellers at the opening but not sufficiently marked to allow the price to register a quotation gap.
Bullish opening
Type : Bullish
Timeframe : Openning
So that you have an overall view of the price change, here is a table showing the variations over several periods:
Near a new HIGH record (1st january)
Type : Bullish
Timeframe : Weekly
Near a new HIGH record (1 month)
Type : Bullish
Timeframe : Weekly
Technical
A technical analysis in Daily of this AIRBNB INC. chart shows a slightly bullish trend. Only 57.14% of the signals given by moving averages are bullish. This slightly bullish trend is reinforced by the strong signals currently being given by short-term moving averages. An assessment of moving averages reveals several bearish signals that could impact this trend:
Bearish price crossover with Moving Average 100
Type : Bearish
Timeframe : Daily
Bearish price crossover with adaptative moving average 100
Type : Bearish
Timeframe : Daily
Technical indicators are strongly bullish, suggesting that the price increase should continue.
But beware of excesses. The Central Indicators scanner currently detects this:
CCI indicator is overbought : over 100
Type : Neutral
Timeframe : Daily
Pivot points : price is over resistance 2
Type : Neutral
Timeframe : Weekly
Ichimoku : price is under the cloud
Type : Bearish
Timeframe : Daily
Price is back under the pivot point
Type : Bearish
Timeframe : Daily
The Central Patterns scanner, which studies chart patterns, resistances and supports, has identified this signal:
Horizontal support is broken
Type : Bearish
Timeframe : Daily
No result was found by the Central Candlesticks scanner on Japanese candlesticks.
| S3 | S2 | S1 | Price | R1 | R2 | R3 | |
|---|---|---|---|---|---|---|---|
| ProTrendLines | 132.09 | 138.41 | 152.97 | 166.53 | 166.54 | 172.72 | 180.08 |
| Change (%) | -20.68% | -16.89% | -8.14% | - | +0.01% | +3.72% | +8.14% |
| Change | -34.44 | -28.12 | -13.56 | - | +0.01 | +6.19 | +13.55 |
| Level | Intermediate | Intermediate | Major | - | Intermediate | Major | Intermediate |
Pivot points can also be used to set your price objectives. Here is the price situation in relation to pivot points:
| Pivot points | S3 | S2 | S1 | PP | R1 | R2 | R3 |
|---|---|---|---|---|---|---|---|
| Standard | 150.08 | 157.46 | 161.99 | 169.37 | 173.90 | 181.28 | 185.81 |
| Camarilla | 163.26 | 164.35 | 165.44 | 166.53 | 167.62 | 168.71 | 169.81 |
| Woodie | 148.67 | 156.75 | 160.58 | 168.66 | 172.49 | 180.57 | 184.40 |
| Fibonacci | 157.46 | 162.01 | 164.82 | 169.37 | 173.92 | 176.73 | 181.28 |
| Pivot points | S3 | S2 | S1 | PP | R1 | R2 | R3 |
|---|---|---|---|---|---|---|---|
| Standard | 130.67 | 142.06 | 154.29 | 165.68 | 177.91 | 189.30 | 201.53 |
| Camarilla | 160.04 | 162.20 | 164.37 | 166.53 | 168.70 | 170.86 | 173.03 |
| Woodie | 131.10 | 142.27 | 154.72 | 165.89 | 178.34 | 189.51 | 201.96 |
| Fibonacci | 142.06 | 151.08 | 156.65 | 165.68 | 174.70 | 180.27 | 189.30 |
| Pivot points | S3 | S2 | S1 | PP | R1 | R2 | R3 |
|---|---|---|---|---|---|---|---|
| Standard | 92.06 | 113.22 | 133.59 | 154.75 | 175.12 | 196.28 | 216.65 |
| Camarilla | 142.55 | 146.36 | 150.16 | 153.97 | 157.78 | 161.58 | 165.39 |
| Woodie | 91.68 | 113.02 | 133.21 | 154.55 | 174.74 | 196.08 | 216.27 |
| Fibonacci | 113.22 | 129.08 | 138.88 | 154.75 | 170.61 | 180.41 | 196.28 |
Numerical data
The following are the details of the technical indicators and moving averages that were collected to generate this technical analysis:
| RSI (14): | 55.86 | |
| MACD (12,26,9): | 0.6700 | |
| Directional Movement: | 8.16 | |
| AROON (14): | 64.29 | |
| DEMA (21): | 158.50 | |
| Parabolic SAR (0,02-0,02-0,2): | 141.19 | |
| Elder Ray (13): | 10.80 | |
| Super Trend (3,10): | 145.44 | |
| Zig ZAG (10): | 166.53 | |
| VORTEX (21): | 0.9200 | |
| Stochastique (14,3,5): | 87.28 | |
| TEMA (21): | 162.69 | |
| Williams %R (14): | -24.67 | |
| Chande Momentum Oscillator (20): | 24.39 | |
| Repulse (5,40,3): | -0.6900 | |
| ROCnROLL: | 1 | |
| TRIX (15,9): | -0.2400 | |
| Courbe Coppock: | 13.90 |
| MA7: | 161.90 | |
| MA20: | 154.99 | |
| MA50: | 163.48 | |
| MA100: | 170.66 | |
| MAexp7: | 163.33 | |
| MAexp20: | 159.22 | |
| MAexp50: | 162.75 | |
| MAexp100: | 165.50 | |
| Price / MA7: | +2.86% | |
| Price / MA20: | +7.45% | |
| Price / MA50: | +1.87% | |
| Price / MA100: | -2.42% | |
| Price / MAexp7: | +1.96% | |
| Price / MAexp20: | +4.59% | |
| Price / MAexp50: | +2.32% | |
| Price / MAexp100: | +0.62% |
About author

Online


Add a comment
Comments
0 comments on the analysis AIRBNB INC. - Daily