THE SANDBOX - SAND/USDT - Daily - Technical analysis published on 07/26/2021 (GMT)
- 311
- 0
Click here for a new analysis!
- Timeframe : Daily
- - Analysis generated on
- Status : TARGET REACHED
Summary of the analysis

Additional analysis
Quotes
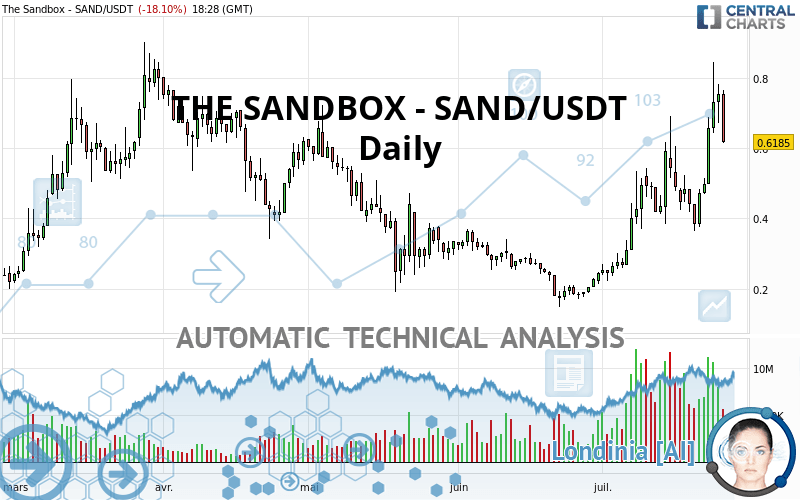
The THE SANDBOX - SAND/USDT rating is 0.618500 USDT. On the day, this instrument lost -18.10% and was traded between 0.614900 USDT and 0.765600 USDT over the period. The price is currently at +0.59% from its lowest and -19.21% from its highest.The Central Gaps scanner detects a bearish opening. A small advantage for sellers in the very short term.
Bearish opening
Type : Bearish
Timeframe : Openning
Here is a more detailed summary of the historical variations registered by THE SANDBOX - SAND/USDT:
Abnormal volumes
Timeframe : 5 days
Abnormal volumes
Timeframe : 20 days
Technical
A technical analysis in Daily of this THE SANDBOX - SAND/USDT chart shows a bullish trend. The signals returned by the moving averages are 78.57% bullish. This bullish trend is reinforced by the strong signals currently being given by short-term moving averages. An assessment of moving averages reveals a bullish signal that could impact this trend:
Bullish trend reversal : Moving Average 100
Type : Bullish
Timeframe : Daily
In fact, according to the parameters integrated into the Central Analyzer system, 12 technical indicators out of 18 analysed are currently bullish. But beware of excesses. The Central Indicators scanner currently detects this:
RSI indicator is overbought : over 70
Type : Neutral
Timeframe : Daily
CCI indicator is overbought : over 100
Type : Neutral
Timeframe : Daily
Previous candle closed over Bollinger bands
Type : Neutral
Timeframe : Daily
CCI indicator: bearish divergence
Type : Bearish
Timeframe : Daily
Williams %R indicator is overbought : over -20
Type : Neutral
Timeframe : Daily
Pivot points : price is under support 1
Type : Neutral
Timeframe : Daily
Price is back over the pivot point
Type : Bullish
Timeframe : Daily
Price is back over the pivot point
Type : Bullish
Timeframe : Weekly
An analysis of the price chart with the Central Patterns scanner (detector of chart patterns and resistances and supports) shows several results that can have an impact on the price change:
Horizontal resistance is broken
Type : Bullish
Timeframe : Daily
Resistance of channel is broken
Type : Bullish
Timeframe : Daily
The Central Candlesticks scanner which studies Japanese candlesticks did not detect anything.
| S3 | S2 | S1 | Price | R1 | R2 | |
|---|---|---|---|---|---|---|
| ProTrendLines | 0.410700 | 0.494000 | 0.590633 | 0.618500 | 0.702500 | 0.826300 |
| Change (%) | -33.60% | -20.13% | -4.51% | - | +13.58% | +33.60% |
| Change | -0.207800 | -0.124500 | -0.027867 | - | +0.084000 | +0.207800 |
| Level | Major | Intermediate | Major | - | Minor | Major |
Pivot points can also be used to set your price objectives. Here is the price situation in relation to pivot points:
| Pivot points | S3 | S2 | S1 | PP | R1 | R2 | R3 |
|---|---|---|---|---|---|---|---|
| Standard | 0.577133 | 0.624067 | 0.689633 | 0.736567 | 0.802133 | 0.849067 | 0.914633 |
| Camarilla | 0.724263 | 0.734575 | 0.744888 | 0.755200 | 0.765513 | 0.775825 | 0.786138 |
| Woodie | 0.586450 | 0.628725 | 0.698950 | 0.741225 | 0.811450 | 0.853725 | 0.923950 |
| Fibonacci | 0.624067 | 0.667042 | 0.693592 | 0.736567 | 0.779542 | 0.806092 | 0.849067 |
| Pivot points | S3 | S2 | S1 | PP | R1 | R2 | R3 |
|---|---|---|---|---|---|---|---|
| Standard | -0.031633 | 0.166233 | 0.448267 | 0.646133 | 0.928167 | 1.126033 | 1.408067 |
| Camarilla | 0.598328 | 0.642318 | 0.686309 | 0.730300 | 0.774291 | 0.818282 | 0.862273 |
| Woodie | 0.010450 | 0.187275 | 0.490350 | 0.667175 | 0.970250 | 1.147075 | 1.450150 |
| Fibonacci | 0.166233 | 0.349555 | 0.462812 | 0.646133 | 0.829455 | 0.942712 | 1.126033 |
| Pivot points | S3 | S2 | S1 | PP | R1 | R2 | R3 |
|---|---|---|---|---|---|---|---|
| Standard | -0.047033 | 0.050133 | 0.147467 | 0.244633 | 0.341967 | 0.439133 | 0.536467 |
| Camarilla | 0.191313 | 0.209142 | 0.226971 | 0.244800 | 0.262629 | 0.280458 | 0.298288 |
| Woodie | -0.046950 | 0.050175 | 0.147550 | 0.244675 | 0.342050 | 0.439175 | 0.536550 |
| Fibonacci | 0.050133 | 0.124432 | 0.170334 | 0.244633 | 0.318932 | 0.364834 | 0.439133 |
Numerical data
The following is the status of the technical indicators and moving averages at the time of publication of this technical analysis:
| RSI (14): | 62.57 | |
| MACD (12,26,9): | 0.0884 | |
| Directional Movement: | 26.248379 | |
| AROON (14): | 28.571430 | |
| DEMA (21): | 0.623318 | |
| Parabolic SAR (0,02-0,02-0,2): | 0.407692 | |
| Elder Ray (13): | 0.135431 | |
| Super Trend (3,10): | 0.426590 | |
| Zig ZAG (10): | 0.653800 | |
| VORTEX (21): | 1.1578 | |
| Stochastique (14,3,5): | 72.76 | |
| TEMA (21): | 0.677044 | |
| Williams %R (14): | -39.65 | |
| Chande Momentum Oscillator (20): | 0.062300 | |
| Repulse (5,40,3): | -2.7916 | |
| ROCnROLL: | 1 | |
| TRIX (15,9): | 2.7725 | |
| Courbe Coppock: | 68.81 |
| MA7: | 0.592386 | |
| MA20: | 0.514885 | |
| MA50: | 0.355194 | |
| MA100: | 0.396401 | |
| MAexp7: | 0.622575 | |
| MAexp20: | 0.515689 | |
| MAexp50: | 0.425847 | |
| MAexp100: | 0.401737 | |
| Price / MA7: | +4.41% | |
| Price / MA20: | +20.12% | |
| Price / MA50: | +74.13% | |
| Price / MA100: | +56.03% | |
| Price / MAexp7: | -0.65% | |
| Price / MAexp20: | +19.94% | |
| Price / MAexp50: | +45.24% | |
| Price / MAexp100: | +53.96% |
About author

Online


Add a comment
Comments
0 comments on the analysis THE SANDBOX - SAND/USDT - Daily