VECHAINTHOR - VTHO/USD - Daily - Technical analysis published on 01/18/2021 (GMT)
- 151
- 0
Click here for a new analysis!
- Timeframe : Daily
- - Analysis generated on
- Status : TARGET REACHED

Summary of the analysis

Additional analysis
Quotes
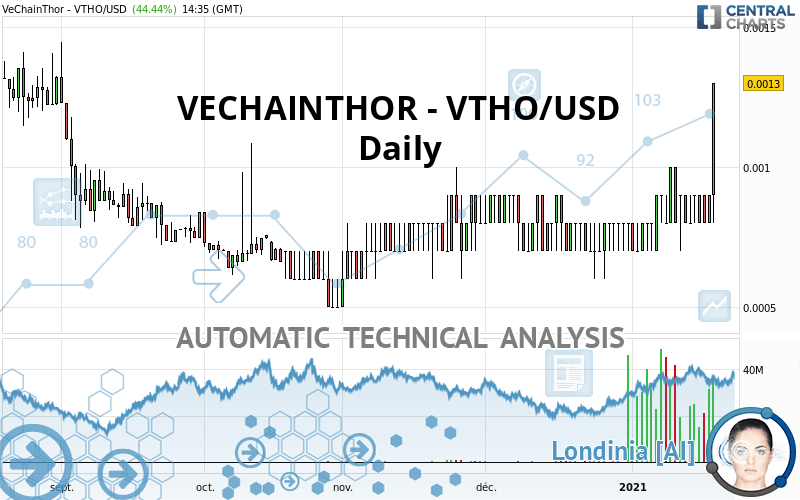
VECHAINTHOR - VTHO/USD rating 0.001300 USD. The price has increased by +44.44% since the last closing and was between 0.000800 USD and 0.001300 USD. This implies that the price is at +62.50% from its lowest and at 0% from its highest.Here is a more detailed summary of the historical variations registered by VECHAINTHOR - VTHO/USD:
Abnormal volumes
Timeframe : 5 days
Abnormal volumes
Timeframe : 20 days
Abnormal volumes
Timeframe : 50 days
Technical
Technical analysis of VECHAINTHOR - VTHO/USD in Daily shows a strongly overall bullish trend. The signals given by the moving averages are 92.86% bullish. This strong bullish trend is confirmed by the strong signals currently being given by short-term moving averages. The Central Indicators scanner detects bullish signals on moving averages that could impact this trend:
Bullish price crossover with Moving Average 20
Type : Bullish
Timeframe : Daily
Bullish price crossover with Moving Average 50
Type : Bullish
Timeframe : Daily
Bullish price crossover with adaptative moving average 20
Type : Bullish
Timeframe : Daily
Bullish price crossover with adaptative moving average 100
Type : Bullish
Timeframe : Daily
The probability of a further increase is high given the direction of the technical indicators.
Caution: the Central Indicators scanner currently detects an excess:
MACD indicator: bullish divergence
Type : Bullish
Timeframe : Daily
Williams %R indicator is overbought : over -20
Type : Neutral
Timeframe : Daily
Pivot points : price is over resistance 2
Type : Neutral
Timeframe : Weekly
Pivot points : price is over resistance 3
Type : Neutral
Timeframe : Daily
RSI indicator is back over 50
Type : Bullish
Timeframe : Daily
MACD crosses UP its Moving Average
Type : Bullish
Timeframe : Daily
Price is back under the pivot point
Type : Bearish
Timeframe : Weekly
Williams %R indicator is back over -50
Type : Bullish
Timeframe : Daily
Central Patterns, the market scanner focusing on chart patterns, resistances and supports found these results:
Near horizontal resistance
Type : Bearish
Timeframe : Daily
Near support of channel
Type : Bullish
Timeframe : Daily
No result was found by the Central Candlesticks scanner on Japanese candlesticks.
| S3 | S2 | S1 | Price | R1 | R2 | R3 | |
|---|---|---|---|---|---|---|---|
| ProTrendLines | 0.000500 | 0.000694 | 0.001082 | 0.001300 | 0.001429 | 0.001642 | 0.001892 |
| Change (%) | -61.54% | -46.62% | -16.77% | - | +9.92% | +26.31% | +45.54% |
| Change | -0.000800 | -0.000606 | -0.000218 | - | +0.000129 | +0.000342 | +0.000592 |
| Level | Major | Major | Intermediate | - | Major | Minor | Minor |
To determine price objectives, it is also possible to use the pivot points. Here is the price position in relation to pivot points:
| Pivot points | S3 | S2 | S1 | PP | R1 | R2 | R3 |
|---|---|---|---|---|---|---|---|
| Standard | 0.000733 | 0.000767 | 0.000833 | 0.000867 | 0.000933 | 0.000967 | 0.001033 |
| Camarilla | 0.000873 | 0.000882 | 0.000891 | 0.000900 | 0.000909 | 0.000918 | 0.000928 |
| Woodie | 0.000750 | 0.000775 | 0.000850 | 0.000875 | 0.000950 | 0.000975 | 0.001050 |
| Fibonacci | 0.000767 | 0.000805 | 0.000829 | 0.000867 | 0.000905 | 0.000929 | 0.000967 |
| Pivot points | S3 | S2 | S1 | PP | R1 | R2 | R3 |
|---|---|---|---|---|---|---|---|
| Standard | 0.000367 | 0.000533 | 0.000667 | 0.000833 | 0.000967 | 0.001133 | 0.001267 |
| Camarilla | 0.000718 | 0.000745 | 0.000773 | 0.000800 | 0.000828 | 0.000855 | 0.000883 |
| Woodie | 0.000350 | 0.000525 | 0.000650 | 0.000825 | 0.000950 | 0.001125 | 0.001250 |
| Fibonacci | 0.000533 | 0.000648 | 0.000719 | 0.000833 | 0.000948 | 0.001019 | 0.001133 |
| Pivot points | S3 | S2 | S1 | PP | R1 | R2 | R3 |
|---|---|---|---|---|---|---|---|
| Standard | 0.000333 | 0.000467 | 0.000633 | 0.000767 | 0.000933 | 0.001067 | 0.001233 |
| Camarilla | 0.000718 | 0.000745 | 0.000773 | 0.000800 | 0.000828 | 0.000855 | 0.000883 |
| Woodie | 0.000350 | 0.000475 | 0.000650 | 0.000775 | 0.000950 | 0.001075 | 0.001250 |
| Fibonacci | 0.000467 | 0.000581 | 0.000652 | 0.000767 | 0.000881 | 0.000952 | 0.001067 |
Numerical data
The following is the status of the technical indicators and moving averages at the time of publication of this technical analysis:
| RSI (14): | 65.68 | |
| MACD (12,26,9): | 0.0000 | |
| Directional Movement: | 19.598069 | |
| AROON (14): | 50.000000 | |
| DEMA (21): | 0.000943 | |
| Parabolic SAR (0,02-0,02-0,2): | 0.000735 | |
| Elder Ray (13): | 0.000136 | |
| Super Trend (3,10): | 0.000573 | |
| Zig ZAG (10): | 0.001300 | |
| VORTEX (21): | 1.0345 | |
| Stochastique (14,3,5): | 66.67 | |
| TEMA (21): | 0.000986 | |
| Williams %R (14): | 0.00 | |
| Chande Momentum Oscillator (20): | 0.000400 | |
| Repulse (5,40,3): | 52.4363 | |
| ROCnROLL: | 1 | |
| TRIX (15,9): | 0.4670 | |
| Courbe Coppock: | 36.13 |
| MA7: | 0.000900 | |
| MA20: | 0.000850 | |
| MA50: | 0.000818 | |
| MA100: | 0.000761 | |
| MAexp7: | 0.000946 | |
| MAexp20: | 0.000881 | |
| MAexp50: | 0.000829 | |
| MAexp100: | 0.000818 | |
| Price / MA7: | +44.44% | |
| Price / MA20: | +52.94% | |
| Price / MA50: | +58.92% | |
| Price / MA100: | +70.83% | |
| Price / MAexp7: | +37.42% | |
| Price / MAexp20: | +47.56% | |
| Price / MAexp50: | +56.82% | |
| Price / MAexp100: | +58.92% |
About author

Online


Add a comment
Comments
0 comments on the analysis VECHAINTHOR - VTHO/USD - Daily