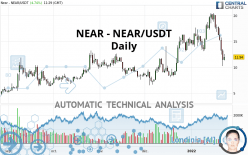
NEAR - NEAR/USDT - Daily - Technical analysis published on 01/23/2022 (GMT)
- 163
- 0
Click here for a new analysis!
- Timeframe : Daily
- - Analysis generated on
- Status : TARGET REACHED

Summary of the analysis

Additional analysis
Quotes
The NEAR - NEAR/USDT price is 11.94 USDT. The price registered an increase of +4.74% on the session and was between 11.32 USDT and 12.55 USDT. This implies that the price is at +5.48% from its lowest and at -4.86% from its highest.A bullish opening was detected by the Central Gaps scanner. Buyers are trying to impose a bullish momentum in the very short term.
Bullish opening
Type : Bullish
Timeframe : Openning
A study of price movements over other periods shows the following variations:
New LOW record (1st january)
Type : Bearish
Timeframe : Weekly
Technical
A technical analysis in Daily of this NEAR - NEAR/USDT chart shows a slightly bullish trend. 53.57% of the signals given by moving averages are bullish. Caution: a reversal of the trend could be possible given the strong bearish signals of short-term moving averages. An assessment of moving averages reveals several bearish and bullish signals:
Bearish price crossover with Moving Average 50
Type : Bearish
Timeframe : Daily
Bullish price crossover with Moving Average 100
Type : Bullish
Timeframe : Daily
Bearish price crossover with adaptative moving average 20
Type : Bearish
Timeframe : Daily
Bearish price crossover with adaptative moving average 50
Type : Bearish
Timeframe : Daily
An assessment of technical indicators shows a strong bearish signal.
Caution: the Central Indicators scanner currently detects an excess:
CCI indicator is oversold : under -100
Type : Neutral
Timeframe : Daily
Williams %R indicator is oversold : under -80
Type : Neutral
Timeframe : Daily
Pivot points : price is under support 1
Type : Neutral
Timeframe : Weekly
Pivot points : price is under support 3
Type : Neutral
Timeframe : Daily
Ichimoku : price is over the cloud
Type : Bullish
Timeframe : Daily
SuperTrend indicator bearish reversal
Type : Bearish
Timeframe : Daily
MACD indicator is back under 0
Type : Bearish
Timeframe : Daily
Price is back over the pivot point
Type : Bullish
Timeframe : Daily
Momentum indicator is back under 0
Type : Bearish
Timeframe : Daily
Central Patterns, the market scanner focusing on chart patterns, resistances and supports found this result:
Near horizontal support
Type : Bullish
Timeframe : Daily
The presence of a bullish Japanese candlestick pattern detected by Central Candlesticks that could cause a very short term rebound was also detected:
Bullish harami
Type : Bullish
Timeframe : Daily
| S2 | S1 | Price | R1 | R2 | R3 | |
|---|---|---|---|---|---|---|
| ProTrendLines | 8.31 | 10.34 | 11.94 | 13.49 | 16.38 | 20.18 |
| Change (%) | -30.40% | -13.40% | - | +12.98% | +37.19% | +69.01% |
| Change | -3.63 | -1.60 | - | +1.55 | +4.44 | +8.24 |
| Level | Minor | Minor | - | Intermediate | Intermediate | Major |
To determine price objectives, it is also possible to use the pivot points. Here is the price position in relation to pivot points:
| Pivot points | S3 | S2 | S1 | PP | R1 | R2 | R3 |
|---|---|---|---|---|---|---|---|
| Standard | 6.59 | 8.39 | 9.90 | 11.70 | 13.21 | 15.01 | 16.52 |
| Camarilla | 10.49 | 10.79 | 11.10 | 11.40 | 11.70 | 12.01 | 12.31 |
| Woodie | 6.44 | 8.32 | 9.75 | 11.63 | 13.06 | 14.94 | 16.37 |
| Fibonacci | 8.39 | 9.66 | 10.44 | 11.70 | 12.97 | 13.75 | 15.01 |
| Pivot points | S3 | S2 | S1 | PP | R1 | R2 | R3 |
|---|---|---|---|---|---|---|---|
| Standard | -2.65 | 3.77 | 7.59 | 14.01 | 17.83 | 24.25 | 28.07 |
| Camarilla | 8.58 | 9.52 | 10.46 | 11.40 | 12.34 | 13.28 | 14.22 |
| Woodie | -3.96 | 3.12 | 6.28 | 13.36 | 16.52 | 23.60 | 26.76 |
| Fibonacci | 3.77 | 7.69 | 10.10 | 14.01 | 17.93 | 20.34 | 24.25 |
| Pivot points | S3 | S2 | S1 | PP | R1 | R2 | R3 |
|---|---|---|---|---|---|---|---|
| Standard | -0.91 | 2.87 | 8.74 | 12.52 | 18.39 | 22.17 | 28.04 |
| Camarilla | 11.97 | 12.85 | 13.74 | 14.62 | 15.51 | 16.39 | 17.27 |
| Woodie | 0.15 | 3.39 | 9.80 | 13.04 | 19.45 | 22.69 | 29.10 |
| Fibonacci | 2.87 | 6.55 | 8.83 | 12.52 | 16.20 | 18.48 | 22.17 |
Numerical data
The following is the status of the technical indicators and moving averages at the time of publication of this technical analysis:
| RSI (14): | 40.28 | |
| MACD (12,26,9): | -0.0200 | |
| Directional Movement: | -14.61 | |
| AROON (14): | -57.15 | |
| DEMA (21): | 15.86 | |
| Parabolic SAR (0,02-0,02-0,2): | 19.44 | |
| Elder Ray (13): | -3.33 | |
| Super Trend (3,10): | 18.17 | |
| Zig ZAG (10): | 12.17 | |
| VORTEX (21): | 0.9300 | |
| Stochastique (14,3,5): | 13.44 | |
| TEMA (21): | 14.69 | |
| Williams %R (14): | -80.78 | |
| Chande Momentum Oscillator (20): | -5.88 | |
| Repulse (5,40,3): | -19.2800 | |
| ROCnROLL: | 2 | |
| TRIX (15,9): | 1.0000 | |
| Courbe Coppock: | 5.88 |
| MA7: | 14.81 | |
| MA20: | 16.19 | |
| MA50: | 13.37 | |
| MA100: | 11.59 | |
| MAexp7: | 14.26 | |
| MAexp20: | 15.40 | |
| MAexp50: | 13.98 | |
| MAexp100: | 12.00 | |
| Price / MA7: | -19.38% | |
| Price / MA20: | -26.25% | |
| Price / MA50: | -10.70% | |
| Price / MA100: | +3.02% | |
| Price / MAexp7: | -16.27% | |
| Price / MAexp20: | -22.47% | |
| Price / MAexp50: | -14.59% | |
| Price / MAexp100: | -0.50% |
About author

Online


Add a comment
Comments
0 comments on the analysis NEAR - NEAR/USDT - Daily