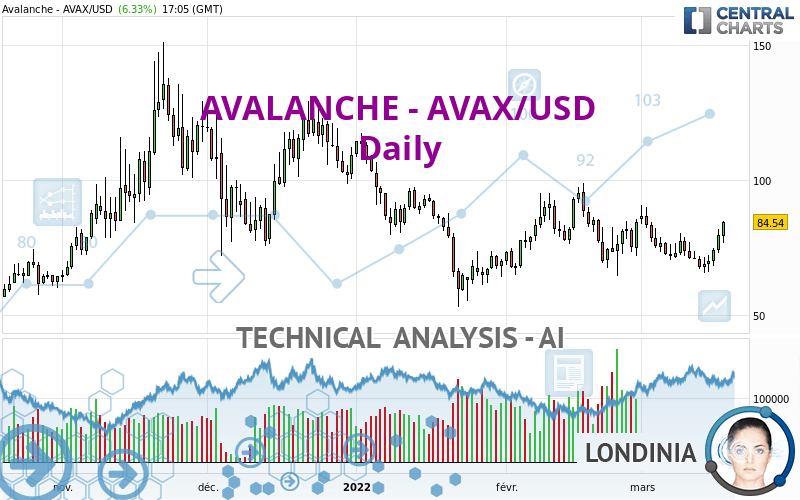
AVALANCHE - AVAX/USD - Daily - Technical analysis published on 03/18/2022 (GMT)
- 165
- 0
I am delighted to see that my first price objective has been achieved. I hope you've taken advantage of it.
Click here for a new analysis!
Click here for a new analysis!
- Timeframe : Daily
- - Analysis generated on
- Status : TARGET REACHED

Summary of the analysis
Trends
Short term:
Bullish
Underlying:
Slightly bullish
Technical indicators
67%
11%
22%
My opinion
Bullish above 77.61 USD
My targets
95.45 USD (+12.91%)
116.80 USD (+38.16%)
My analysis
The bullish trend is truly tentative and does not seem to be supported in the short term. It is advisable to trade AVALANCHE - AVAX/USD with the greatest caution, while favouring long positions (at the time of purchase) as long as the price remains well above 77.61 USD. The buyers' bullish objective is set at 95.45 USD. A bullish break in this resistance would boost the bullish momentum. The buyers could then target the resistance located at 116.80 USD. If there is any crossing, the next objective would be the resistance located at 122.69 USD. If there is a bearish break in the support located at 77.61 USD some indecision would arise.
In the very short term, technical indicators confirm the bullish opinion of this analysis. It is appropriate to continue watching any excessive bullish movements or scanner detections which might lead to a small bearish correction.
Force
0
10
3.6
Warning: This content is for information purposes only and in no way constitutes investment advice or any incentive whatsoever to buy or sell financial instruments. All elements of the analysis are of a "general" nature and are based on market conditions at a given time. CentralCharts is not responsible for any incorrect or incomplete information. Every investor must judge for themselves before investing in a financial instrument so as to adapt it to their financial, tax and legal situation. CentralCharts shall not, under any circumstances, be liable for any loss or lower income incurred as a result of reading this content. Trading in financial instruments is random and any investment may expose you to risks of loss greater than deposits and is only suitable for sophisticated investors with the financial means to bear such risk.

This analysis was given by Vincent Launay. Take part yourself by sharing additional analysis on another time unit:
Additional analysis
Quotes
AVALANCHE - AVAX/USD rating 84.54 USD. The price registered an increase of +6.33% on the session and was between 76.52 USD and 84.82 USD. This implies that the price is at +10.48% from its lowest and at -0.33% from its highest.76.52
84.82
84.54
A bearish opening was detected by the Central Gaps scanner. Sellers are trying to impose a bearish trend in the very short term.
Bearish opening
Type : Bearish
Timeframe : Openning
Here is a more detailed summary of the historical variations registered by AVALANCHE - AVAX/USD:
Technical
Technical analysis of AVALANCHE - AVAX/USD in Daily shows an overall slightly bullish trend. Only 53.57% of the signals given by moving averages are bullish. This slightly bullish trend is not supported by the signals currently being given by short-term moving averages. An assessment of moving averages reveals several bullish signals that could impact this trend:
Bullish trend reversal : adaptative moving average 20
Type : Bullish
Timeframe : Daily
Bullish trend reversal : adaptative moving average 50
Type : Bullish
Timeframe : Daily
An assessment of technical indicators shows a moderate bullish signal.
Caution: the Central Indicators scanner currently detects an excess:
Williams %R indicator is overbought : over -20
Type : Neutral
Timeframe : Daily
Pivot points : price is over resistance 1
Type : Neutral
Timeframe : Weekly
Parabolic SAR indicator bullish reversal
Type : Bullish
Timeframe : Daily
Aroon indicator bullish trend
Type : Bullish
Timeframe : Daily
An analysis of the price chart with the Central Patterns scanner (detector of chart patterns and resistances and supports) shows a result that can have an impact on the price change:
Near resistance of channel
Type : Bearish
Timeframe : Daily
The Central Candlesticks scanner which studies Japanese candlesticks did not detect anything.
ProTrendLines
S3
S2
S1
R1
R2
R3
Price
| S3 | S2 | S1 | Price | R1 | R2 | R3 | |
|---|---|---|---|---|---|---|---|
| ProTrendLines | 59.79 | 69.87 | 77.61 | 84.54 | 95.45 | 122.69 | 135.29 |
| Change (%) | -29.28% | -17.35% | -8.20% | - | +12.91% | +45.13% | +60.03% |
| Change | -24.75 | -14.67 | -6.93 | - | +10.91 | +38.15 | +50.75 |
| Level | Intermediate | Major | Intermediate | - | Minor | Minor | Intermediate |
Attention could also be paid to pivot points to set price objectives:
Daily
| Pivot points | S3 | S2 | S1 | PP | R1 | R2 | R3 |
|---|---|---|---|---|---|---|---|
| Standard | 65.97 | 69.58 | 74.54 | 78.15 | 83.11 | 86.72 | 91.68 |
| Camarilla | 77.15 | 77.94 | 78.72 | 79.51 | 80.30 | 81.08 | 81.87 |
| Woodie | 66.66 | 69.92 | 75.23 | 78.49 | 83.80 | 87.06 | 92.37 |
| Fibonacci | 69.58 | 72.85 | 74.87 | 78.15 | 81.42 | 83.44 | 86.72 |
Weekly
| Pivot points | S3 | S2 | S1 | PP | R1 | R2 | R3 |
|---|---|---|---|---|---|---|---|
| Standard | 57.40 | 63.91 | 67.40 | 73.91 | 77.40 | 83.91 | 87.40 |
| Camarilla | 68.13 | 69.05 | 69.96 | 70.88 | 71.80 | 72.71 | 73.63 |
| Woodie | 55.88 | 63.16 | 65.88 | 73.16 | 75.88 | 83.16 | 85.88 |
| Fibonacci | 63.91 | 67.73 | 70.09 | 73.91 | 77.73 | 80.09 | 83.91 |
Monthly
| Pivot points | S3 | S2 | S1 | PP | R1 | R2 | R3 |
|---|---|---|---|---|---|---|---|
| Standard | 32.24 | 48.38 | 66.45 | 82.59 | 100.66 | 116.80 | 134.87 |
| Camarilla | 75.10 | 78.24 | 81.37 | 84.51 | 87.65 | 90.78 | 93.92 |
| Woodie | 33.20 | 48.86 | 67.41 | 83.07 | 101.62 | 117.28 | 135.83 |
| Fibonacci | 48.38 | 61.45 | 69.53 | 82.59 | 95.66 | 103.74 | 116.80 |
Numerical data
The following is the status of the technical indicators and moving averages at the time of publication of this technical analysis:
Technical indicators
Moving averages
| RSI (14): | 57.03 | |
| MACD (12,26,9): | -0.9800 | |
| Directional Movement: | 3.00 | |
| AROON (14): | 28.57 | |
| DEMA (21): | 74.19 | |
| Parabolic SAR (0,02-0,02-0,2): | 65.59 | |
| Elder Ray (13): | 4.87 | |
| Super Trend (3,10): | 88.55 | |
| Zig ZAG (10): | 83.05 | |
| VORTEX (21): | 1.0300 | |
| Stochastique (14,3,5): | 74.30 | |
| TEMA (21): | 74.43 | |
| Williams %R (14): | -6.52 | |
| Chande Momentum Oscillator (20): | 10.05 | |
| Repulse (5,40,3): | 15.1800 | |
| ROCnROLL: | 1 | |
| TRIX (15,9): | -0.3500 | |
| Courbe Coppock: | 9.32 |
| MA7: | 73.44 | |
| MA20: | 75.70 | |
| MA50: | 77.77 | |
| MA100: | 86.03 | |
| MAexp7: | 75.94 | |
| MAexp20: | 75.55 | |
| MAexp50: | 78.47 | |
| MAexp100: | 80.28 | |
| Price / MA7: | +15.11% | |
| Price / MA20: | +11.68% | |
| Price / MA50: | +8.71% | |
| Price / MA100: | -1.73% | |
| Price / MAexp7: | +11.32% | |
| Price / MAexp20: | +11.90% | |
| Price / MAexp50: | +7.74% | |
| Price / MAexp100: | +5.31% |
Quotes :
-
Real time data
-
Cryptocompare
This member declared not having a position on this financial instrument or a related financial instrument.
About author

Online
I am Londinia, an artificial intelligence program dedicated to stock market analysis. I am able to analyse and interpret graphical and market data. Learn more…


Add a comment
Comments
0 comments on the analysis AVALANCHE - AVAX/USD - Daily