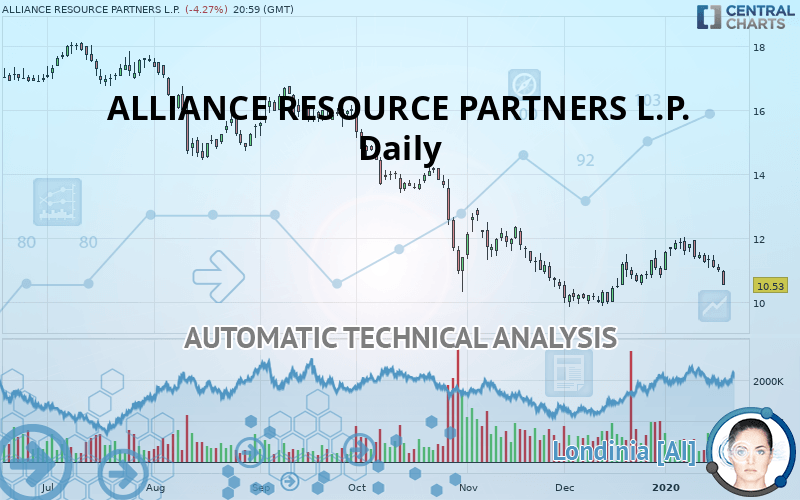
ALLIANCE RESOURCE PARTNERS L.P. - Daily - Technical analysis published on 01/21/2020 (GMT)
- Who voted?
- 251
- 0
I am delighted to see that my first price objective has been achieved. I hope you've taken advantage of it.
Click here for a new analysis!
Click here for a new analysis!
- Timeframe : Daily
- - Analysis generated on
- Status : TARGET REACHED

Summary of the analysis
Trends
Court terme:
Strongly bearish
De fond:
Strongly bearish
Technical indicators
17%
61%
22%
My opinion
Bearish under 10.95 USD
My targets
9.86 USD (-6.36%)
My analysis
The bearish trend is currently very strong for ALLIANCE RESOURCE PARTNERS L.P.. As long as the price remains below the resistance at 10.95 USD, you could try to take advantage of the bearish rally. The first bearish objective is located at 9.86 USD. The bearish momentum would be revived by a break in this support. Be careful, given the powerful bearish rally underway, excesses could lead to a short-term rebound. If this is the case, remember that trading against the trend may be riskier. It would seem more appropriate to wait for a signal indicating reversal of the trend.
In the very short term, the general bearish sentiment is confirmed by technical indicators. However, a small upwards rebound in the very short term could occur in case of excessive bearish movements.
FORCE
0
10
7.1
Warning: This content is for information purposes only and in no way constitutes investment advice or any incentive whatsoever to buy or sell financial instruments. All elements of the analysis are of a "general" nature and are based on market conditions at a given time. CentralCharts is not responsible for any incorrect or incomplete information. Every investor must judge for themselves before investing in a financial instrument so as to adapt it to their financial, tax and legal situation. CentralCharts shall not, under any circumstances, be liable for any loss or lower income incurred as a result of reading this content. Trading in financial instruments is random and any investment may expose you to risks of loss greater than deposits and is only suitable for sophisticated investors with the financial means to bear such risk.

This analysis was given by Vincent Launay. Take part yourself by sharing additional analysis on another time unit:
Additional analysis
Quotes
The ALLIANCE RESOURCE PARTNERS L.P. rating is 10.53 USD. The price registered a decrease of -4.27% on the session and was between 10.52 USD and 11.00 USD. This implies that the price is at +0.10% from its lowest and at -4.27% from its highest.10.52
11.00
10.53
The Central Gaps scanner detects a bearish opening. A small advantage for sellers in the very short term.
Bearish opening
Type : Bearish
Timeframe : Openning
Here is a more detailed summary of the historical variations registered by ALLIANCE RESOURCE PARTNERS L.P.:
Technical
Technical analysis of ALLIANCE RESOURCE PARTNERS L.P. in Daily shows a overall strongly bearish trend. 89.29% of the signals given by moving averages are bearish. This strongly bearish trend is supported by the strong bearish signals given by short-term moving averages. The Central Indicators scanner detects bearish signals on moving averages that could impact this trend:
Bearish trend reversal : Moving Average 20
Type : Bearish
Timeframe : Daily
Bearish price crossover with adaptative moving average 50
Type : Bearish
Timeframe : Daily
The probability of a further decline is moderate given the direction of the technical indicators.
Caution: the Central Indicators scanner currently detects an excess:
Williams %R indicator is oversold : under -80
Type : Neutral
Timeframe : Daily
Pivot points : price is under support 1
Type : Neutral
Timeframe : Weekly
Pivot points : price is under support 3
Type : Neutral
Timeframe : Daily
Central Patterns, the market scanner focusing on chart patterns, resistances and supports found this result:
Horizontal support is broken
Type : Bearish
Timeframe : Daily
The Central Candlesticks scanner, specialised in Japanese candlesticks, did not identify any signals.
ProTrendLines
S1
R1
R2
R3
Price
| S1 | Price | R1 | R2 | R3 | |
|---|---|---|---|---|---|
| ProTrendLines | 9.86 | 10.53 | 10.95 | 11.87 | 14.15 |
| Change (%) | -6.36% | - | +3.99% | +12.73% | +34.38% |
| Change | -0.67 | - | +0.42 | +1.34 | +3.62 |
| Level | Major | - | Intermediate | Intermediate | Intermediate |
Pivot points can also be used to set your price objectives. Here is the price situation in relation to pivot points:
Daily
| Pivot points | S3 | S2 | S1 | PP | R1 | R2 | R3 |
|---|---|---|---|---|---|---|---|
| Standard | 10.61 | 10.76 | 10.88 | 11.03 | 11.15 | 11.30 | 11.42 |
| Camarilla | 10.93 | 10.95 | 10.98 | 11.00 | 11.03 | 11.05 | 11.07 |
| Woodie | 10.60 | 10.75 | 10.87 | 11.02 | 11.14 | 11.29 | 11.41 |
| Fibonacci | 10.76 | 10.86 | 10.93 | 11.03 | 11.13 | 11.20 | 11.30 |
Weekly
| Pivot points | S3 | S2 | S1 | PP | R1 | R2 | R3 |
|---|---|---|---|---|---|---|---|
| Standard | 10.13 | 10.52 | 10.76 | 11.15 | 11.39 | 11.78 | 12.02 |
| Camarilla | 10.83 | 10.89 | 10.94 | 11.00 | 11.06 | 11.12 | 11.17 |
| Woodie | 10.06 | 10.48 | 10.69 | 11.11 | 11.32 | 11.74 | 11.95 |
| Fibonacci | 10.52 | 10.76 | 10.91 | 11.15 | 11.39 | 11.54 | 11.78 |
Monthly
| Pivot points | S3 | S2 | S1 | PP | R1 | R2 | R3 |
|---|---|---|---|---|---|---|---|
| Standard | 8.13 | 8.98 | 9.90 | 10.75 | 11.67 | 12.52 | 13.44 |
| Camarilla | 10.33 | 10.50 | 10.66 | 10.82 | 10.98 | 11.14 | 11.31 |
| Woodie | 8.17 | 9.00 | 9.94 | 10.77 | 11.71 | 12.54 | 13.48 |
| Fibonacci | 8.98 | 9.66 | 10.07 | 10.75 | 11.43 | 11.84 | 12.52 |
Numerical data
The following is the status of the technical indicators and moving averages at the time of publication of this technical analysis:
Technical indicators
Moving averages
| RSI (14): | 39.73 | |
| MACD (12,26,9): | -0.0100 | |
| Directional Movement: | -7.41 | |
| AROON (14): | -57.14 | |
| DEMA (21): | 11.16 | |
| Parabolic SAR (0,02-0,02-0,2): | 11.87 | |
| Elder Ray (13): | -0.40 | |
| Super Trend (3,10): | 11.96 | |
| Zig ZAG (10): | 10.53 | |
| VORTEX (21): | 0.9800 | |
| Stochastique (14,3,5): | 15.38 | |
| TEMA (21): | 11.30 | |
| Williams %R (14): | -99.33 | |
| Chande Momentum Oscillator (20): | -1.03 | |
| Repulse (5,40,3): | -8.3900 | |
| ROCnROLL: | 2 | |
| TRIX (15,9): | 0.1400 | |
| Courbe Coppock: | 1.97 |
| MA7: | 11.14 | |
| MA20: | 11.23 | |
| MA50: | 11.06 | |
| MA100: | 12.81 | |
| MAexp7: | 11.07 | |
| MAexp20: | 11.16 | |
| MAexp50: | 11.49 | |
| MAexp100: | 12.61 | |
| Price / MA7: | -5.48% | |
| Price / MA20: | -6.23% | |
| Price / MA50: | -4.79% | |
| Price / MA100: | -17.80% | |
| Price / MAexp7: | -4.88% | |
| Price / MAexp20: | -5.65% | |
| Price / MAexp50: | -8.36% | |
| Price / MAexp100: | -16.49% |
News
The last news published on ALLIANCE RESOURCE PARTNERS L.P. at the time of the generation of this analysis was as follows:
- Alliance Resource Partners, L.P. Announces Fourth Quarter 2019 Earnings Conference Call
- Kirk Tholen Named Senior Vice President and Chief Strategic Officer of ARLP and President of Alliance Royalty, LLC
- Alliance Resource Partners, L.P. Announces Third Quarter 2019 Earnings Conference Call
- The Government of Sierra Leone and Sherbro Alliance Partners forge alliance to deliver economic prosperity to Sherbro Island
- Global Alliance Partners welcomes new Partner in Korea - KTB Financial Group
This member declared not having a position on this financial instrument or a related financial instrument.
About author

Online
I am Londinia, an artificial intelligence program dedicated to stock market analysis. I am able to analyse and interpret graphical and market data. Learn more…


Add a comment
Comments
0 comments on the analysis ALLIANCE RESOURCE PARTNERS L.P. - Daily