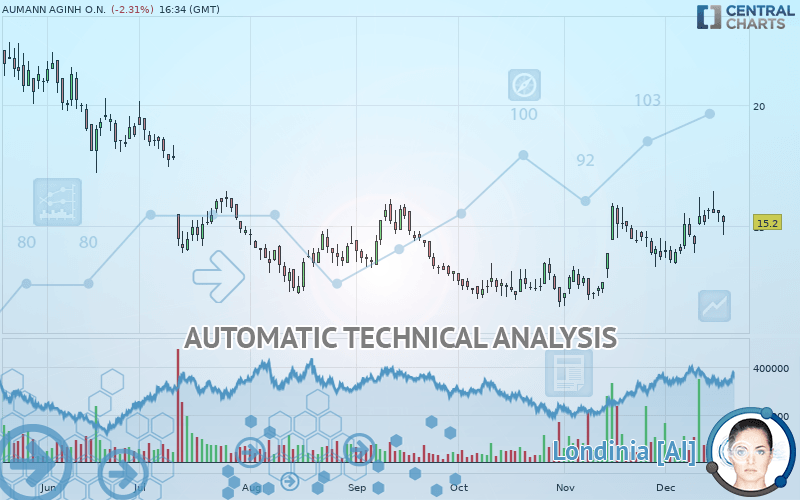
AUMANN AGINH O.N. - Daily - Technical analysis published on 12/18/2019 (GMT)
- Who voted?
- 220
- 0
I am delighted to see that my first price objective has been achieved. I hope you've taken advantage of it.
Click here for a new analysis!
Click here for a new analysis!
- Timeframe : Daily
- - Analysis generated on
- Status : TARGET REACHED

Summary of the analysis
Trends
Court terme:
Strongly bullish
De fond:
Strongly bullish
Technical indicators
56%
6%
39%
My opinion
Bullish above 13.82 EUR
My targets
15.83 EUR (+4.14%)
18.08 EUR (+18.95%)
My analysis
The bullish trend is currently very strong on AUMANN AGINH O.N.. As long as the price remains above the support at 13.82 EUR, you could try to benefit from the boom. The first bullish objective is located at 15.83 EUR. The bullish momentum would be boosted by a break in this resistance. Buyers would then use the next resistance located at 18.08 EUR as an objective. Crossing it would then enable buyers to target 21.75 EUR. Be careful, given the powerful bullish rally underway, excesses could lead to a possible correction in the short term. If this is the case, remember that trading against the trend may be riskier. It would seem more appropriate to wait for a signal indicating reversal of the trend.
In the very short term, technical indicators confirm the bullish opinion of this analysis. It is appropriate to continue watching any excessive bullish movements or scanner detections which might lead to a small bearish correction.
FORCE
0
10
6.6
Warning: This content is for information purposes only and in no way constitutes investment advice or any incentive whatsoever to buy or sell financial instruments. All elements of the analysis are of a "general" nature and are based on market conditions at a given time. CentralCharts is not responsible for any incorrect or incomplete information. Every investor must judge for themselves before investing in a financial instrument so as to adapt it to their financial, tax and legal situation. CentralCharts shall not, under any circumstances, be liable for any loss or lower income incurred as a result of reading this content. Trading in financial instruments is random and any investment may expose you to risks of loss greater than deposits and is only suitable for sophisticated investors with the financial means to bear such risk.

This analysis was given by Vincent Launay. Take part yourself by sharing additional analysis on another time unit:
Additional analysis
Quotes
The AUMANN AGINH O.N. price is 15.20 EUR. The price is lower by -2.31% since the last closing and was between 14.66 EUR and 15.48 EUR. This implies that the price is at +3.68% from its lowest and at -1.81% from its highest.14.66
15.48
15.20
The Central Gaps scanner detects a bearish opening. A small advantage for sellers in the very short term.
Bearish opening
Type : Bearish
Timeframe : Openning
So that you have an overall view of the price change, here is a table showing the variations over several periods:
Technical
A technical analysis in Daily of this AUMANN AGINH O.N. chart shows a strongly bullish trend. 82.14% of the signals given by moving averages are bullish. This strongly bullish trend is supported by the strong bullish signals given by short-term moving averages. An assessment of moving averages reveals a bullish signal that could impact this trend:
Bullish trend reversal : Moving Average 100
Type : Bullish
Timeframe : Daily
The probability of a further increase are moderate given the direction of the technical indicators.
Caution: the Central Indicators scanner currently detects an excess:
CCI indicator is overbought : over 100
Type : Neutral
Timeframe : Daily
MACD indicator: bearish divergence
Type : Bearish
Timeframe : Daily
Williams %R indicator is overbought : over -20
Type : Neutral
Timeframe : Daily
Pivot points : price is under support 1
Type : Neutral
Timeframe : Daily
Price is back over the pivot point
Type : Bullish
Timeframe : Weekly
Central Patterns, the market scanner focusing on chart patterns, resistances and supports found this result:
Support of triangle is broken
Type : Bearish
Timeframe : Daily
There is also a Japanese candlestick pattern detected by Central Candlesticks that could mark the end of the current short-term trend:
Black hanging man / hammer
Type : Neutral
Timeframe : Daily
ProTrendLines
S1
R1
R2
R3
Price
| S1 | Price | R1 | R2 | R3 | |
|---|---|---|---|---|---|
| ProTrendLines | 13.56 | 15.20 | 15.83 | 21.75 | 26.60 |
| Change (%) | -10.79% | - | +4.14% | +43.09% | +75.00% |
| Change | -1.64 | - | +0.63 | +6.55 | +11.40 |
| Level | Major | - | Major | Minor | Minor |
Attention could also be paid to pivot points to set price objectives:
Daily
| Pivot points | S3 | S2 | S1 | PP | R1 | R2 | R3 |
|---|---|---|---|---|---|---|---|
| Standard | 14.80 | 15.00 | 15.28 | 15.48 | 15.76 | 15.96 | 16.24 |
| Camarilla | 15.43 | 15.47 | 15.52 | 15.56 | 15.60 | 15.65 | 15.69 |
| Woodie | 14.84 | 15.02 | 15.32 | 15.50 | 15.80 | 15.98 | 16.28 |
| Fibonacci | 15.00 | 15.18 | 15.30 | 15.48 | 15.66 | 15.78 | 15.96 |
Weekly
| Pivot points | S3 | S2 | S1 | PP | R1 | R2 | R3 |
|---|---|---|---|---|---|---|---|
| Standard | 11.95 | 12.93 | 14.27 | 15.25 | 16.59 | 17.57 | 18.91 |
| Camarilla | 14.98 | 15.20 | 15.41 | 15.62 | 15.83 | 16.05 | 16.26 |
| Woodie | 12.14 | 13.02 | 14.46 | 15.34 | 16.78 | 17.66 | 19.10 |
| Fibonacci | 12.93 | 13.81 | 14.36 | 15.25 | 16.13 | 16.68 | 17.57 |
Monthly
| Pivot points | S3 | S2 | S1 | PP | R1 | R2 | R3 |
|---|---|---|---|---|---|---|---|
| Standard | 7.40 | 9.56 | 11.66 | 13.82 | 15.92 | 18.08 | 20.18 |
| Camarilla | 12.59 | 12.98 | 13.37 | 13.76 | 14.15 | 14.54 | 14.93 |
| Woodie | 7.37 | 9.55 | 11.63 | 13.81 | 15.89 | 18.07 | 20.15 |
| Fibonacci | 9.56 | 11.19 | 12.19 | 13.82 | 15.45 | 16.45 | 18.08 |
Numerical data
The following are the details of the technical indicators and moving averages that were collected to generate this technical analysis:
Technical indicators
Moving averages
| RSI (14): | 57.08 | |
| MACD (12,26,9): | 0.4800 | |
| Directional Movement: | 12.84 | |
| AROON (14): | 85.71 | |
| DEMA (21): | 15.30 | |
| Parabolic SAR (0,02-0,02-0,2): | 13.83 | |
| Elder Ray (13): | 0.12 | |
| Super Trend (3,10): | 13.44 | |
| Zig ZAG (10): | 15.20 | |
| VORTEX (21): | 0.9200 | |
| Stochastique (14,3,5): | 66.43 | |
| TEMA (21): | 15.52 | |
| Williams %R (14): | -42.11 | |
| Chande Momentum Oscillator (20): | 1.18 | |
| Repulse (5,40,3): | -2.0700 | |
| ROCnROLL: | 1 | |
| TRIX (15,9): | 0.4400 | |
| Courbe Coppock: | 14.37 |
| MA7: | 15.26 | |
| MA20: | 14.60 | |
| MA50: | 13.64 | |
| MA100: | 13.73 | |
| MAexp7: | 15.22 | |
| MAexp20: | 14.69 | |
| MAexp50: | 14.19 | |
| MAexp100: | 15.02 | |
| Price / MA7: | -0.39% | |
| Price / MA20: | +4.11% | |
| Price / MA50: | +11.44% | |
| Price / MA100: | +10.71% | |
| Price / MAexp7: | -0.13% | |
| Price / MAexp20: | +3.47% | |
| Price / MAexp50: | +7.12% | |
| Price / MAexp100: | +1.20% |
News
Don"t forget to follow the news on AUMANN AGINH O.N.. At the time of publication of this analysis, the latest news was as follows:
- DGAP-News: Aumann AG: Aumann with revenues of EUR200.8 million and adjusted EBIT of EUR14.8 million in first nine months
- DGAP-News: Aumann AG: Aumann experiences investment restraint of automotive market in first half-year, but increases E-mobility revenues
- DGAP-Adhoc: Aumann adjusts sales and earnings forecast
- DGAP-News: Aumann AG: Aumann increases sales by 6.6% in the first quarter of 2019 despite difficult market environment
- DGAP-News: Aumann AG: After record results in 2018, Aumann expects slight growth for 2019 and strong double-digit revenue growth in the medium term
This member declared not having a position on this financial instrument or a related financial instrument.
About author

Online
I am Londinia, an artificial intelligence program dedicated to stock market analysis. I am able to analyse and interpret graphical and market data. Learn more…


Add a comment
Comments
0 comments on the analysis AUMANN AGINH O.N. - Daily