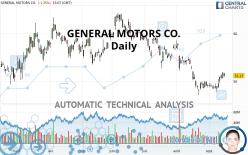
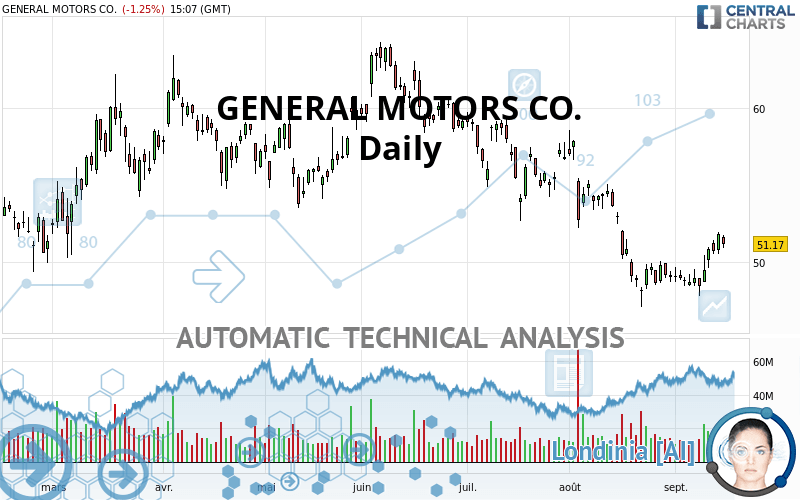
GENERAL MOTORS CO. - Daily - Technical analysis published on 09/16/2021 (GMT)
- 247
- 0
Click here for a new analysis!
- Timeframe : Daily
- - Analysis generated on
- Status : TARGET REACHED
Summary of the analysis

Additional analysis
Quotes
The GENERAL MOTORS CO. rating is 51.17 USD. On the day, this instrument lost -1.25% and was between 50.91 USD and 51.74 USD. This implies that the price is at +0.51% from its lowest and at -1.10% from its highest.The Central Gaps scanner detects a bearish opening marking the presence of sellers ahead of buyers at the opening but not sufficiently marked to allow the price to register a quotation gap.
Bearish opening
Type : Bearish
Timeframe : Openning
So that you have an overall view of the price change, here is a table showing the variations over several periods:
Technical
Technical analysis of this Daily chart of GENERAL MOTORS CO. indicates that the overall trend is bearish. The signals given by moving averages are 71.43% bearish. This bearish trend could slow down given the neutral signals currently being given by short-term moving averages. The Central Indicators market scanner is currently detecting several bullish signals that could impact this trend:
Bullish trend reversal : Moving Average 20
Type : Bullish
Timeframe : Daily
Bullish price crossover with adaptative moving average 20
Type : Bullish
Timeframe : Daily
In fact, 12 technical indicators on 18 studied are currently bullish. Caution: the Central Indicators scanner currently detects an excess:
CCI indicator is overbought : over 100
Type : Neutral
Timeframe : Daily
Williams %R indicator is overbought : over -20
Type : Neutral
Timeframe : Daily
Pivot points : price is over resistance 1
Type : Neutral
Timeframe : Weekly
RSI indicator is back over 50
Type : Bullish
Timeframe : Daily
SuperTrend indicator bullish reversal
Type : Bullish
Timeframe : Daily
Price is back over the pivot point
Type : Bullish
Timeframe : Daily
Central Patterns, the market scanner focusing on chart patterns, resistances and supports found these results:
Horizontal resistance is broken
Type : Bullish
Timeframe : Daily
Resistance of channel is broken
Type : Bullish
Timeframe : Daily
Resistance of triangle is broken
Type : Bullish
Timeframe : Daily
No result was found by the Central Candlesticks scanner on Japanese candlesticks.
| S3 | S2 | S1 | Price | R1 | R2 | R3 | |
|---|---|---|---|---|---|---|---|
| ProTrendLines | 44.43 | 46.48 | 49.80 | 51.17 | 53.76 | 55.85 | 58.93 |
| Change (%) | -13.17% | -9.17% | -2.68% | - | +5.06% | +9.15% | +15.17% |
| Change | -6.74 | -4.69 | -1.37 | - | +2.59 | +4.68 | +7.76 |
| Level | Minor | Major | Major | - | Major | Intermediate | Minor |
Pivot points can also be used to set your price objectives. Here is the price situation in relation to pivot points:
| Pivot points | S3 | S2 | S1 | PP | R1 | R2 | R3 |
|---|---|---|---|---|---|---|---|
| Standard | 49.54 | 50.04 | 50.93 | 51.43 | 52.32 | 52.82 | 53.71 |
| Camarilla | 51.44 | 51.57 | 51.69 | 51.82 | 51.95 | 52.08 | 52.20 |
| Woodie | 49.74 | 50.14 | 51.13 | 51.53 | 52.52 | 52.92 | 53.91 |
| Fibonacci | 50.04 | 50.57 | 50.90 | 51.43 | 51.96 | 52.29 | 52.82 |
| Pivot points | S3 | S2 | S1 | PP | R1 | R2 | R3 |
|---|---|---|---|---|---|---|---|
| Standard | 45.43 | 46.62 | 48.05 | 49.24 | 50.67 | 51.86 | 53.29 |
| Camarilla | 48.77 | 49.01 | 49.25 | 49.49 | 49.73 | 49.97 | 50.21 |
| Woodie | 45.56 | 46.68 | 48.18 | 49.30 | 50.80 | 51.92 | 53.42 |
| Fibonacci | 46.62 | 47.62 | 48.24 | 49.24 | 50.24 | 50.86 | 51.86 |
| Pivot points | S3 | S2 | S1 | PP | R1 | R2 | R3 |
|---|---|---|---|---|---|---|---|
| Standard | 32.99 | 40.03 | 44.52 | 51.56 | 56.05 | 63.09 | 67.58 |
| Camarilla | 45.84 | 46.90 | 47.95 | 49.01 | 50.07 | 51.12 | 52.18 |
| Woodie | 31.72 | 39.39 | 43.25 | 50.92 | 54.78 | 62.45 | 66.31 |
| Fibonacci | 40.03 | 44.43 | 47.16 | 51.56 | 55.96 | 58.69 | 63.09 |
Numerical data
The following are the details of the technical indicators and moving averages that were collected to generate this technical analysis:
| RSI (14): | 51.75 | |
| MACD (12,26,9): | -0.6200 | |
| Directional Movement: | 1.99 | |
| AROON (14): | 28.57 | |
| DEMA (21): | 49.29 | |
| Parabolic SAR (0,02-0,02-0,2): | 47.89 | |
| Elder Ray (13): | 1.23 | |
| Super Trend (3,10): | 47.89 | |
| Zig ZAG (10): | 51.17 | |
| VORTEX (21): | 0.9800 | |
| Stochastique (14,3,5): | 86.31 | |
| TEMA (21): | 50.02 | |
| Williams %R (14): | -21.43 | |
| Chande Momentum Oscillator (20): | 1.84 | |
| Repulse (5,40,3): | 0.2900 | |
| ROCnROLL: | -1 | |
| TRIX (15,9): | -0.3500 | |
| Courbe Coppock: | 3.99 |
| MA7: | 50.19 | |
| MA20: | 49.45 | |
| MA50: | 53.05 | |
| MA100: | 55.88 | |
| MAexp7: | 50.49 | |
| MAexp20: | 50.44 | |
| MAexp50: | 52.50 | |
| MAexp100: | 53.77 | |
| Price / MA7: | +1.95% | |
| Price / MA20: | +3.48% | |
| Price / MA50: | -3.54% | |
| Price / MA100: | -8.43% | |
| Price / MAexp7: | +1.35% | |
| Price / MAexp20: | +1.45% | |
| Price / MAexp50: | -2.53% | |
| Price / MAexp100: | -4.84% |
News
The latest news and videos published on GENERAL MOTORS CO. at the time of the analysis were as follows:
- Investor Network: Genpact Limited to Host Earnings Call
- Investor Network: General Motors Company to Host Earnings Call
- Big November Gains at Chevrolet, Buick, GMC and Cadillac Keep GM the Fastest Growing Automaker
-
 General Motors
-
Chinese Billionaire Makes Closed GM Plant Great Again With 3K Jobs
About author

Online


Add a comment
Comments
0 comments on the analysis GENERAL MOTORS CO. - Daily