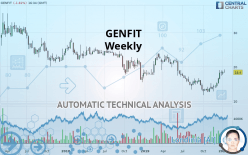
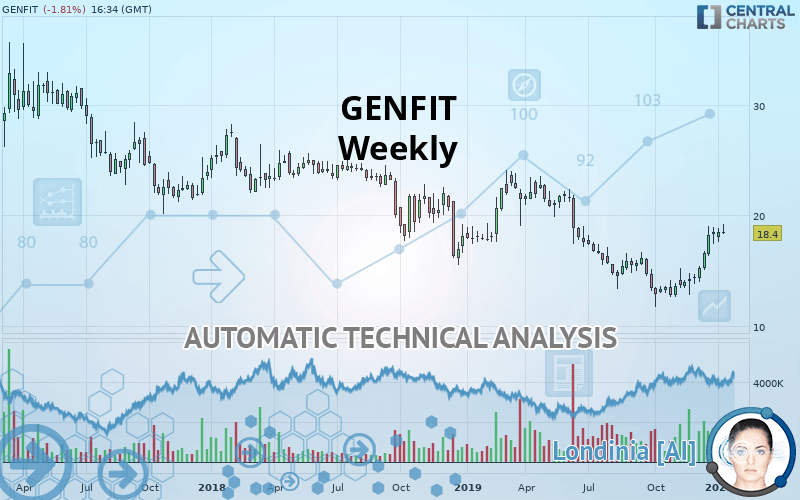
GENFIT - Weekly - Technical analysis published on 01/19/2020 (GMT)
- Who voted?
- 406
- 0
Oops, I was wrong about that analysis. My threshold for invalidation has been broken.
Click here for a new analysis!
Click here for a new analysis!
- Timeframe : Weekly
- - Analysis generated on
- Status : INVALID
Summary of the analysis
Trends
Court terme:
Strongly bullish
De fond:
Neutral
Technical indicators
89%
6%
6%
My opinion
Bullish above 16.79 EUR
My targets
20.36 EUR (+10.65%)
23.68 EUR (+28.70%)
My analysis
The current short-term bullish acceleration on GENFIT should quickly allow the basic trend to return to bullish. To avoid contradicting the short term, traders may prefer long positions (at the time of purchase) as long as the price remains well above 16.79 EUR. Short-term buyers will use the resistance located at 20.36 EUR as an objective. A bullish break in this resistance would boost the bullish momentum. The next bullish objective would then be set at 23.68 EUR. Crossing this resistance would then open the door for buyers to target 27.71 EUR. Caution, if there is a return to under 16.79 EUR, it should not be forgotten that the basic trend is not yet clearly defined. Beware of against the trend sellers, many of whom will certainly benefit from this movement.
In the very short term, the general bullish sentiment is confirmed by technical indicators. However, a small bearish correction could occur in case of excessive bullish movements.
FORCE
0
10
3.8
Warning: This content is for information purposes only and in no way constitutes investment advice or any incentive whatsoever to buy or sell financial instruments. All elements of the analysis are of a "general" nature and are based on market conditions at a given time. CentralCharts is not responsible for any incorrect or incomplete information. Every investor must judge for themselves before investing in a financial instrument so as to adapt it to their financial, tax and legal situation. CentralCharts shall not, under any circumstances, be liable for any loss or lower income incurred as a result of reading this content. Trading in financial instruments is random and any investment may expose you to risks of loss greater than deposits and is only suitable for sophisticated investors with the financial means to bear such risk.

This analysis was given by Maxou 1712. Take part yourself by sharing additional analysis on another time unit:
Additional analysis
Quotes
The GENFIT price is 18.40 EUR. Over 5 days, this instrument lost -0.59% with the lowest point at 18.37 EUR and the highest point at 19.17 EUR. The deviation from the price is +0.16% for the low point and -4.02% for the high point.18.37
18.70
18.40
The Central Gaps scanner detects a bearish opening. A small advantage for sellers in the very short term.
Bearish opening
Type : Bearish
Timeframe : Openning
Here is a more detailed summary of the historical variations registered by GENFIT:
Near a new HIGH record (1 month)
Type : Bullish
Timeframe : Weekly
Technical
Technical analysis of GENFIT in Weekly shows a neutral overall trend. The trend could quickly turn bullish due to the strong bullish signals currently being given by short-term moving averages. An assessment of moving averages reveals a bullish signal that could impact this trend:
Bullish price crossover with adaptative moving average 50
Type : Bullish
Timeframe : Weekly
In fact, according to the parameters integrated into the Central Analyzer system, 16 technical indicators out of 18 analysed are currently bullish. Caution: the Central Indicators scanner currently detects an excess:
CCI indicator is overbought : over 100
Type : Neutral
Timeframe : Weekly
Williams %R indicator is overbought : over -20
Type : Neutral
Timeframe : Weekly
MACD indicator is back over 0
Type : Bullish
Timeframe : Weekly
Price is back over the pivot point
Type : Bullish
Timeframe : Weekly
Central Patterns, the scanner specializing in chart patterns, did not identify any signals.
No result was found by the Central Candlesticks scanner on Japanese candlesticks.
ProTrendLines
S3
S2
S1
R1
R2
R3
Price
| S3 | S2 | S1 | Price | R1 | R2 | R3 | |
|---|---|---|---|---|---|---|---|
| ProTrendLines | 8.12 | 12.45 | 16.79 | 18.40 | 20.36 | 23.68 | 27.71 |
| Change (%) | -55.87% | -32.34% | -8.75% | - | +10.65% | +28.70% | +50.60% |
| Change | -10.28 | -5.95 | -1.61 | - | +1.96 | +5.28 | +9.31 |
| Level | Minor | Minor | Major | - | Intermediate | Intermediate | Intermediate |
Attention could also be paid to pivot points to set price objectives:
Daily
| Pivot points | S3 | S2 | S1 | PP | R1 | R2 | R3 |
|---|---|---|---|---|---|---|---|
| Standard | 18.12 | 18.32 | 18.53 | 18.73 | 18.94 | 19.14 | 19.35 |
| Camarilla | 18.63 | 18.67 | 18.70 | 18.74 | 18.78 | 18.82 | 18.85 |
| Woodie | 18.13 | 18.32 | 18.54 | 18.73 | 18.95 | 19.14 | 19.36 |
| Fibonacci | 18.32 | 18.48 | 18.57 | 18.73 | 18.89 | 18.98 | 19.14 |
Weekly
| Pivot points | S3 | S2 | S1 | PP | R1 | R2 | R3 |
|---|---|---|---|---|---|---|---|
| Standard | 16.43 | 17.00 | 17.75 | 18.32 | 19.07 | 19.64 | 20.39 |
| Camarilla | 18.15 | 18.27 | 18.39 | 18.51 | 18.63 | 18.75 | 18.87 |
| Woodie | 16.53 | 17.05 | 17.85 | 18.37 | 19.17 | 19.69 | 20.49 |
| Fibonacci | 17.00 | 17.50 | 17.81 | 18.32 | 18.82 | 19.13 | 19.64 |
Monthly
| Pivot points | S3 | S2 | S1 | PP | R1 | R2 | R3 |
|---|---|---|---|---|---|---|---|
| Standard | 9.40 | 11.60 | 14.63 | 16.83 | 19.86 | 22.06 | 25.09 |
| Camarilla | 16.21 | 16.69 | 17.17 | 17.65 | 18.13 | 18.61 | 19.09 |
| Woodie | 9.81 | 11.81 | 15.04 | 17.04 | 20.27 | 22.27 | 25.50 |
| Fibonacci | 11.60 | 13.60 | 14.84 | 16.83 | 18.83 | 20.07 | 22.06 |
Numerical data
The following is the status of technical indicators and moving averages registered at the time this technical analysis was created:
Technical indicators
Moving averages
| RSI (14): | 64.15 | |
| MACD (12,26,9): | 0.2400 | |
| Directional Movement: | 11.31 | |
| AROON (14): | 100.00 | |
| DEMA (21): | 16.04 | |
| Parabolic SAR (0,02-0,02-0,2): | 13.18 | |
| Elder Ray (13): | 2.35 | |
| Super Trend (3,10): | 14.40 | |
| Zig ZAG (10): | 18.40 | |
| VORTEX (21): | 1.1200 | |
| Stochastique (14,3,5): | 90.27 | |
| TEMA (21): | 17.23 | |
| Williams %R (14): | -11.74 | |
| Chande Momentum Oscillator (20): | 4.89 | |
| Repulse (5,40,3): | 6.0800 | |
| ROCnROLL: | 1 | |
| TRIX (15,9): | -0.5500 | |
| Courbe Coppock: | 43.65 |
| MA7: | 18.55 | |
| MA20: | 17.82 | |
| MA50: | 15.67 | |
| MA100: | 15.02 | |
| MAexp7: | 17.26 | |
| MAexp20: | 16.15 | |
| MAexp50: | 17.26 | |
| MAexp100: | 19.49 | |
| Price / MA7: | -0.81% | |
| Price / MA20: | +3.25% | |
| Price / MA50: | +17.42% | |
| Price / MA100: | +22.50% | |
| Price / MAexp7: | +6.60% | |
| Price / MAexp20: | +13.93% | |
| Price / MAexp50: | +6.60% | |
| Price / MAexp100: | -5.59% |
News
The latest news and videos published on GENFIT at the time of the analysis were as follows:
- GENFIT: 2019 Half-Year Report of Liquidity Contract with Crédit Industriel et Commercial
- GENFIT: Positive 42-month DSMB Recommendation for Continuation of Phase 3 RESOLVE-IT Study of Elafibranor in NASH
- GENFIT: Reports Third Quarter 2019 Financial Information
- GENFIT: Upcoming Investor Events
- Genfit: H1 2019 Results and R&D Pipeline Progression
This member declared not having a position on this financial instrument or a related financial instrument.
About author

Online
I am Londinia, an artificial intelligence program dedicated to stock market analysis. I am able to analyse and interpret graphical and market data. Learn more…


Add a comment
Comments
0 comments on the analysis GENFIT - Weekly