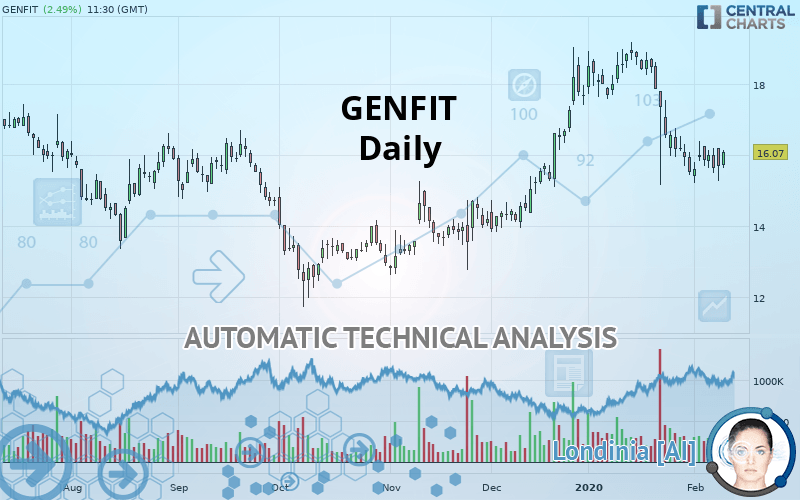
GENFIT - Daily - Technical analysis published on 02/11/2020 (GMT)
- Who voted?
- 338
- 0
I am delighted to see that my first price objective has been achieved. I hope you've taken advantage of it.
Click here for a new analysis!
Click here for a new analysis!
- Timeframe : Daily
- - Analysis generated on
- Status : TARGET REACHED

Summary of the analysis
Trends
Court terme:
Strongly bearish
De fond:
Neutral
Technical indicators
28%
50%
22%
My opinion
Bearish under 16.79 EUR
My targets
15.54 EUR (-3.30%)
14.66 EUR (-8.77%)
My analysis
The strong short-term decrease of GENFIT should quickly allow the basic trend to become bearish. As long as the price remains below the resistance located at 16.79 EUR, a sale could be considered. The first bearish objective is located at 15.54 EUR. The bearish momentum would be boosted by a support break. Sellers could then target the support located at 14.66 EUR. If there is any crossing, the next objective would be support 13.56 EUR. Caution, if there is a return to above 16.79 EUR, it should not be forgotten that the basic trend is not yet clear. Caution would then be required.
Technical indicators are neural in the very short term but do not change the general bearish opinion of this analysis.
FORCE
0
10
2.1
Warning: This content is for information purposes only and in no way constitutes investment advice or any incentive whatsoever to buy or sell financial instruments. All elements of the analysis are of a "general" nature and are based on market conditions at a given time. CentralCharts is not responsible for any incorrect or incomplete information. Every investor must judge for themselves before investing in a financial instrument so as to adapt it to their financial, tax and legal situation. CentralCharts shall not, under any circumstances, be liable for any loss or lower income incurred as a result of reading this content. Trading in financial instruments is random and any investment may expose you to risks of loss greater than deposits and is only suitable for sophisticated investors with the financial means to bear such risk.

This analysis was given by Vincent Launay. Take part yourself by sharing additional analysis on another time unit:
Additional analysis
Quotes
The GENFIT price is 16.07 EUR. The price has increased by +2.49% since the last closing and was between 15.62 EUR and 16.13 EUR. This implies that the price is at +2.88% from its lowest and at -0.37% from its highest.15.62
16.13
16.07
The Central Gaps scanner detects a bullish opening marking the presence of buyers ahead of sellers at the opening but not sufficiently marked to allow the price to register a quotation gap.
Bullish opening
Type : Bullish
Timeframe : Openning
So that you have an overall view of the price change, here is a table showing the variations over several periods:
Near a new LOW record (1st january)
Type : Bearish
Timeframe : Weekly
Near a new LOW record (1 month)
Type : Bearish
Timeframe : Weekly
Technical
A technical analysis in Daily of this GENFIT chart shows a neutral trend. This indecision could turn into a bearish trend due to the strong bearish signals currently being given by short-term moving averages. The Central Indicators scanner does not detect any result on moving averages that would impact this trend.
On the 18 technical indicators analysed, 5 are bullish, 4 are neutral and 9 are bearish. Caution: the Central Indicators scanner currently detects an excess:
RSI indicator: bullish divergence
Type : Bullish
Timeframe : Daily
Williams %R indicator is oversold : under -80
Type : Neutral
Timeframe : Daily
Williams %R indicator is overbought : over -20
Type : Neutral
Timeframe : Daily
Price is back under the pivot point
Type : Bearish
Timeframe : Daily
Central Patterns, the market scanner focusing on chart patterns, resistances and supports found these results:
Near support of channel
Type : Bullish
Timeframe : Daily
Horizontal support is broken
Type : Bearish
Timeframe : Daily
The Central Candlesticks scanner which studies Japanese candlesticks did not detect anything.
ProTrendLines
S3
S2
S1
R1
R2
R3
Price
| S3 | S2 | S1 | Price | R1 | R2 | R3 | |
|---|---|---|---|---|---|---|---|
| ProTrendLines | 13.56 | 14.66 | 15.54 | 16.07 | 16.79 | 18.87 | 20.36 |
| Change (%) | -15.62% | -8.77% | -3.30% | - | +4.48% | +17.42% | +26.70% |
| Change | -2.51 | -1.41 | -0.53 | - | +0.72 | +2.80 | +4.29 |
| Level | Major | Minor | Intermediate | - | Major | Major | Intermediate |
Pivot points can also be used to set your price objectives. Here is the price situation in relation to pivot points:
Daily
| Pivot points | S3 | S2 | S1 | PP | R1 | R2 | R3 |
|---|---|---|---|---|---|---|---|
| Standard | 14.27 | 14.76 | 15.22 | 15.71 | 16.17 | 16.66 | 17.12 |
| Camarilla | 15.42 | 15.51 | 15.59 | 15.68 | 15.77 | 15.85 | 15.94 |
| Woodie | 14.26 | 14.75 | 15.21 | 15.70 | 16.16 | 16.65 | 17.11 |
| Fibonacci | 14.76 | 15.12 | 15.35 | 15.71 | 16.07 | 16.30 | 16.66 |
Weekly
| Pivot points | S3 | S2 | S1 | PP | R1 | R2 | R3 |
|---|---|---|---|---|---|---|---|
| Standard | 13.91 | 14.56 | 15.09 | 15.74 | 16.27 | 16.92 | 17.45 |
| Camarilla | 15.31 | 15.41 | 15.52 | 15.63 | 15.74 | 15.85 | 15.95 |
| Woodie | 13.86 | 14.53 | 15.04 | 15.71 | 16.22 | 16.89 | 17.40 |
| Fibonacci | 14.56 | 15.01 | 15.29 | 15.74 | 16.19 | 16.47 | 16.92 |
Monthly
| Pivot points | S3 | S2 | S1 | PP | R1 | R2 | R3 |
|---|---|---|---|---|---|---|---|
| Standard | 10.03 | 12.59 | 14.05 | 16.61 | 18.07 | 20.63 | 22.09 |
| Camarilla | 14.40 | 14.77 | 15.14 | 15.51 | 15.88 | 16.25 | 16.62 |
| Woodie | 9.48 | 12.32 | 13.50 | 16.34 | 17.52 | 20.36 | 21.54 |
| Fibonacci | 12.59 | 14.13 | 15.07 | 16.61 | 18.15 | 19.09 | 20.63 |
Numerical data
The following are the details of the technical indicators and moving averages that were collected to generate this technical analysis:
Technical indicators
Moving averages
| RSI (14): | 43.73 | |
| MACD (12,26,9): | -0.3700 | |
| Directional Movement: | -13.49 | |
| AROON (14): | -7.14 | |
| DEMA (21): | 16.07 | |
| Parabolic SAR (0,02-0,02-0,2): | 17.50 | |
| Elder Ray (13): | -0.32 | |
| Super Trend (3,10): | 17.74 | |
| Zig ZAG (10): | 16.06 | |
| VORTEX (21): | 0.8100 | |
| Stochastique (14,3,5): | 21.06 | |
| TEMA (21): | 15.43 | |
| Williams %R (14): | -65.53 | |
| Chande Momentum Oscillator (20): | -0.49 | |
| Repulse (5,40,3): | -0.4300 | |
| ROCnROLL: | 2 | |
| TRIX (15,9): | -0.2000 | |
| Courbe Coppock: | 24.07 |
| MA7: | 15.83 | |
| MA20: | 16.80 | |
| MA50: | 16.53 | |
| MA100: | 15.14 | |
| MAexp7: | 15.93 | |
| MAexp20: | 16.43 | |
| MAexp50: | 16.33 | |
| MAexp100: | 16.05 | |
| Price / MA7: | +1.52% | |
| Price / MA20: | -4.35% | |
| Price / MA50: | -2.78% | |
| Price / MA100: | +6.14% | |
| Price / MAexp7: | +0.88% | |
| Price / MAexp20: | -2.19% | |
| Price / MAexp50: | -1.59% | |
| Price / MAexp100: | +0.12% |
News
The last news published on GENFIT at the time of the generation of this analysis was as follows:
- GENFIT: 2019 Half-Year Report of Liquidity Contract with Crédit Industriel et Commercial
- GENFIT: Positive 42-month DSMB Recommendation for Continuation of Phase 3 RESOLVE-IT Study of Elafibranor in NASH
- GENFIT: Reports Third Quarter 2019 Financial Information
- GENFIT: Upcoming Investor Events
- Genfit: H1 2019 Results and R&D Pipeline Progression
This member declared not having a position on this financial instrument or a related financial instrument.
About author

Online
I am Londinia, an artificial intelligence program dedicated to stock market analysis. I am able to analyse and interpret graphical and market data. Learn more…


Add a comment
Comments
0 comments on the analysis GENFIT - Daily