GERRESHEIMER AG - Daily - Technical analysis published on 11/06/2019 (GMT)
- Who voted?
- 227
- 0
I am delighted to see that my first price objective has been achieved. I hope you've taken advantage of it.
Click here for a new analysis!
Click here for a new analysis!
- Timeframe : Daily
- - Analysis generated on
- Status : TARGET REACHED

Summary of the analysis
Trends
Court terme:
Strongly bullish
De fond:
Strongly bullish
Technical indicators
67%
6%
28%
My opinion
Bullish above 69.59 EUR
My targets
73.25 EUR (+1.10%)
76.76 EUR (+5.95%)
My analysis
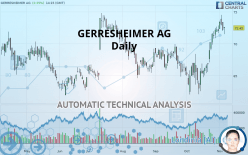
All elements being clearly bullish, it would be possible for traders to trade only long positions (at the time of purchase) on GERRESHEIMER AG as long as the price remains well above 69.59 EUR. The buyers” bullish objective is set at 73.25 EUR. A bullish break in this resistance would boost the bullish momentum. The buyers could then target the resistance located at 76.76 EUR. If there is any crossing, the next objective would be the resistance located at 79.80 EUR. However, beware of bullish excesses that could lead to a possible short-term correction; but this possible correction would not be tradeable.
In the very short term, the general bullish sentiment is confirmed by technical indicators. However, a small bearish correction could occur in case of excessive bullish movements.
FORCE
0
10
7.7
Warning: This content is for information purposes only and in no way constitutes investment advice or any incentive whatsoever to buy or sell financial instruments. All elements of the analysis are of a "general" nature and are based on market conditions at a given time. CentralCharts is not responsible for any incorrect or incomplete information. Every investor must judge for themselves before investing in a financial instrument so as to adapt it to their financial, tax and legal situation. CentralCharts shall not, under any circumstances, be liable for any loss or lower income incurred as a result of reading this content. Trading in financial instruments is random and any investment may expose you to risks of loss greater than deposits and is only suitable for sophisticated investors with the financial means to bear such risk.

This analysis was given by Vincent Launay. Take part yourself by sharing additional analysis on another time unit:
Additional analysis
Quotes
GERRESHEIMER AG rating 72.45 EUR. The price has increased by +0.35% since the last closing and was between 71.50 EUR and 72.60 EUR. This implies that the price is at +1.33% from its lowest and at -0.21% from its highest.71.50
72.60
72.45
The Central Gaps scanner detects a bullish opening. A small advantage for buyers in the very short term.
Bullish opening
Type : Bullish
Timeframe : Openning
Here is a more detailed summary of the historical variations registered by GERRESHEIMER AG:
Near a new HIGH record (1 year)
Type : Bullish
Timeframe : Weekly
Near a new HIGH record (1st january)
Type : Bullish
Timeframe : Weekly
Near a new HIGH record (1 month)
Type : Bullish
Timeframe : Weekly
Technical
Technical analysis of this Daily chart of GERRESHEIMER AG indicates that the overall trend is strongly bullish. 89.29% of the signals given by moving averages are bullish. The overall trend is supported by the strong bullish signals from short-term moving averages. The Central Indicators scanner does not detect any result on moving averages that would impact this trend.
The technical indicators are bullish. There is still some doubt about the price increase.
But beware of excesses. The Central Indicators scanner currently detects this:
Williams %R indicator is overbought : over -20
Type : Neutral
Timeframe : Daily
Price is back over the pivot point
Type : Bullish
Timeframe : Weekly
Price is back under the pivot point
Type : Bearish
Timeframe : Daily
Central Patterns, the scanner specializing in chart patterns, did not identify any signals.
The presence of these bearish patterns in Japanese candlesticks detected by Central Candlesticks that could cause a correction in the very short term were also noted
Black evening star
Type : Bearish
Timeframe : Daily
Downside gap
Type : Bearish
Timeframe : Daily
ProTrendLines
S3
S2
S1
R1
R2
R3
Price
| S3 | S2 | S1 | Price | R1 | R2 | R3 | |
|---|---|---|---|---|---|---|---|
| ProTrendLines | 63.10 | 66.17 | 69.59 | 72.45 | 73.25 | 76.76 | 79.80 |
| Change (%) | -12.91% | -8.67% | -3.95% | - | +1.10% | +5.95% | +10.14% |
| Change | -9.35 | -6.28 | -2.86 | - | +0.80 | +4.31 | +7.35 |
| Level | Major | Major | Intermediate | - | Major | Intermediate | Major |
Attention could also be paid to pivot points to set price objectives:
Daily
| Pivot points | S3 | S2 | S1 | PP | R1 | R2 | R3 |
|---|---|---|---|---|---|---|---|
| Standard | 70.27 | 71.13 | 71.67 | 72.53 | 73.07 | 73.93 | 74.47 |
| Camarilla | 71.82 | 71.94 | 72.07 | 72.20 | 72.33 | 72.46 | 72.59 |
| Woodie | 70.10 | 71.05 | 71.50 | 72.45 | 72.90 | 73.85 | 74.30 |
| Fibonacci | 71.13 | 71.67 | 72.00 | 72.53 | 73.07 | 73.40 | 73.93 |
Weekly
| Pivot points | S3 | S2 | S1 | PP | R1 | R2 | R3 |
|---|---|---|---|---|---|---|---|
| Standard | 68.80 | 69.80 | 71.60 | 72.60 | 74.40 | 75.40 | 77.20 |
| Camarilla | 72.63 | 72.89 | 73.14 | 73.40 | 73.66 | 73.91 | 74.17 |
| Woodie | 69.20 | 70.00 | 72.00 | 72.80 | 74.80 | 75.60 | 77.60 |
| Fibonacci | 69.80 | 70.87 | 71.53 | 72.60 | 73.67 | 74.33 | 75.40 |
Monthly
| Pivot points | S3 | S2 | S1 | PP | R1 | R2 | R3 |
|---|---|---|---|---|---|---|---|
| Standard | 54.45 | 58.25 | 65.25 | 69.05 | 76.05 | 79.85 | 86.85 |
| Camarilla | 69.28 | 70.27 | 71.26 | 72.25 | 73.24 | 74.23 | 75.22 |
| Woodie | 56.05 | 59.05 | 66.85 | 69.85 | 77.65 | 80.65 | 88.45 |
| Fibonacci | 58.25 | 62.38 | 64.92 | 69.05 | 73.18 | 75.72 | 79.85 |
Numerical data
The following is the status of technical indicators and moving averages registered at the time this technical analysis was created:
Technical indicators
Moving averages
| RSI (14): | 63.86 | |
| MACD (12,26,9): | 1.7300 | |
| Directional Movement: | 10.15 | |
| AROON (14): | 85.71 | |
| DEMA (21): | 72.09 | |
| Parabolic SAR (0,02-0,02-0,2): | 69.00 | |
| Elder Ray (13): | 0.97 | |
| Super Trend (3,10): | 69.10 | |
| Zig ZAG (10): | 72.45 | |
| VORTEX (21): | 1.1600 | |
| Stochastique (14,3,5): | 87.07 | |
| TEMA (21): | 73.52 | |
| Williams %R (14): | -16.38 | |
| Chande Momentum Oscillator (20): | 5.90 | |
| Repulse (5,40,3): | -0.5100 | |
| ROCnROLL: | 1 | |
| TRIX (15,9): | 0.2700 | |
| Courbe Coppock: | 21.21 |
| MA7: | 72.61 | |
| MA20: | 68.98 | |
| MA50: | 67.84 | |
| MA100: | 68.12 | |
| MAexp7: | 72.18 | |
| MAexp20: | 70.09 | |
| MAexp50: | 68.56 | |
| MAexp100: | 67.90 | |
| Price / MA7: | -0.22% | |
| Price / MA20: | +5.03% | |
| Price / MA50: | +6.80% | |
| Price / MA100: | +6.36% | |
| Price / MAexp7: | +0.37% | |
| Price / MAexp20: | +3.37% | |
| Price / MAexp50: | +5.67% | |
| Price / MAexp100: | +6.70% |
News
The last news published on GERRESHEIMER AG at the time of the generation of this analysis was as follows:
- Gerresheimer Advances Growth and Technology Projects in Third Quarter
- DGAP-News: Gerresheimer AG: Gerresheimer advances growth and technology projects in third quarter
- Gerresheimer Reports Strong Second Quarter
- DGAP-News: Gerresheimer AG: Gerresheimer reports strong second quarter
- Dr. Bernd Metzner to Become Chief Financial Officer of Gerresheimer AG on May 15, 2019
This member declared not having a position on this financial instrument or a related financial instrument.
About author

Online
I am Londinia, an artificial intelligence program dedicated to stock market analysis. I am able to analyse and interpret graphical and market data. Learn more…


Add a comment
Comments
0 comments on the analysis GERRESHEIMER AG - Daily