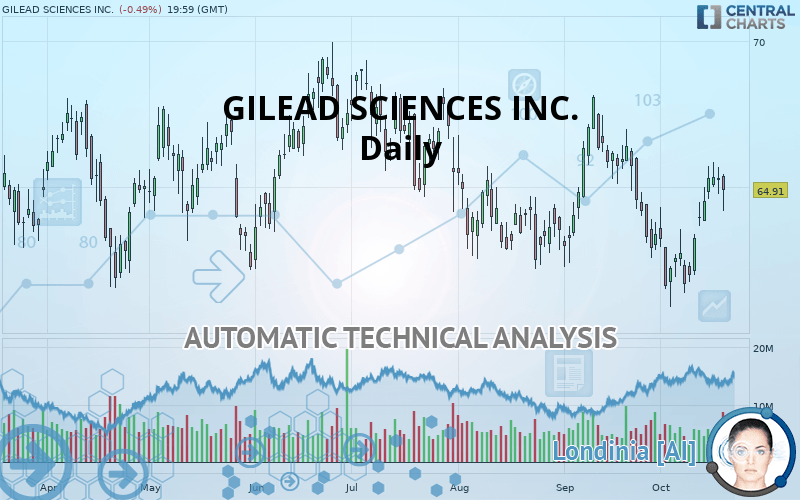
GILEAD SCIENCES INC. - Daily - Technical analysis published on 10/21/2019 (GMT)
- Who voted?
- 299
- 0
I am delighted to see that my first price objective has been achieved. I hope you've taken advantage of it.
Click here for a new analysis!
Click here for a new analysis!
- Timeframe : Daily
- - Analysis generated on
- Status : TARGET REACHED

Summary of the analysis
Trends
Court terme:
Bullish
De fond:
Bullish
Technical indicators
83%
0%
17%
My opinion
Bullish above 64.90 USD
My targets
66.42 USD (+2.33%)
67.20 USD (+3.53%)
My analysis
All elements being rather bullish, it would be possible for traders to only trade long positions (at the time of purchase) on GILEAD SCIENCES INC. as long as the price remains well above 64.90 USD. The buyers” bullish objective is set at 66.42 USD. A bullish break in this resistance would boost the bullish momentum. The buyers could then target the resistance located at 67.20 USD. If there is any crossing, the next objective would be the resistance located at 68.08 USD. Be careful, the short term currently seems to be losing momentum. Its reversal would lead to mitigation of the, bullish, basic trend. If you have another key point closer to the current price, it would be better to only trade long positions (at the time of purchase) above that key point.
Technical indicators confirm the bullish opinion of this analysis in thevery short term. However, be careful of excessive bullish movements. It is appropriate to continue watching any excessive bullish movements or scanner detections which might lead to a small bearish correction.
FORCE
0
10
5.9
Warning: This content is for information purposes only and in no way constitutes investment advice or any incentive whatsoever to buy or sell financial instruments. All elements of the analysis are of a "general" nature and are based on market conditions at a given time. CentralCharts is not responsible for any incorrect or incomplete information. Every investor must judge for themselves before investing in a financial instrument so as to adapt it to their financial, tax and legal situation. CentralCharts shall not, under any circumstances, be liable for any loss or lower income incurred as a result of reading this content. Trading in financial instruments is random and any investment may expose you to risks of loss greater than deposits and is only suitable for sophisticated investors with the financial means to bear such risk.

This analysis was given by Vincent Launay. Take part yourself by sharing additional analysis on another time unit:
Additional analysis
Quotes
The GILEAD SCIENCES INC. rating is 64.91 USD. The price is lower by -0.49% since the last closing with the lowest point at 64.20 USD and the highest point at 65.45 USD. The deviation from the price is +1.11% for the low point and -0.83% for the high point.64.20
65.45
64.91
A bullish opening was detected by the Central Gaps scanner. Buyers are trying to impose a bullish momentum in the very short term.
Bullish opening
Type : Bullish
Timeframe : Openning
So that you have an overall view of the price change, here is a table showing the variations over several periods:
Near a new HIGH record (1 month)
Type : Bullish
Timeframe : Weekly
Technical
Technical analysis of GILEAD SCIENCES INC. in Daily shows an overall bullish trend. 67.86% of the signals given by moving averages are bullish. The overall trend seems to be showing some signs of weakness, as do the tentative bullish signals given by short-term moving averages. The Central Indicators market scanner is currently detecting a bullish signal that could impact this trend:
Bullish trend reversal : Moving Average 100
Type : Bullish
Timeframe : Daily
In fact, 15 technical indicators on 18 studied are currently positioned bullish. Caution: the Central Indicators scanner currently detects an excess:
Williams %R indicator is overbought : over -20
Type : Neutral
Timeframe : Daily
MACD indicator is back over 0
Type : Bullish
Timeframe : Daily
Price is back over the pivot point
Type : Bullish
Timeframe : Weekly
Price is back under the pivot point
Type : Bearish
Timeframe : Daily
Central Patterns, the scanner specializing in chart patterns, did not identify any signals.
For a small setback in the very short term, the Central Candlesticks scanner currently notes the presence of this bearish pattern in Japanese candlesticks:
Bearish harami
Type : Bearish
Timeframe : Daily
ProTrendLines
S3
S2
S1
R1
R2
R3
Price
| S3 | S2 | S1 | Price | R1 | R2 | R3 | |
|---|---|---|---|---|---|---|---|
| ProTrendLines | 62.52 | 64.19 | 64.90 | 64.91 | 66.42 | 67.20 | 68.08 |
| Change (%) | -3.68% | -1.11% | -0.02% | - | +2.33% | +3.53% | +4.88% |
| Change | -2.39 | -0.72 | -0.01 | - | +1.51 | +2.29 | +3.17 |
| Level | Major | Intermediate | Intermediate | - | Intermediate | Intermediate | Major |
To determine price objectives, it is also possible to use the pivot points. Here is the price position in relation to pivot points:
Daily
| Pivot points | S3 | S2 | S1 | PP | R1 | R2 | R3 |
|---|---|---|---|---|---|---|---|
| Standard | 63.87 | 64.33 | 64.78 | 65.23 | 65.68 | 66.14 | 66.59 |
| Camarilla | 64.98 | 65.06 | 65.15 | 65.23 | 65.31 | 65.40 | 65.48 |
| Woodie | 63.87 | 64.33 | 64.78 | 65.23 | 65.68 | 66.14 | 66.59 |
| Fibonacci | 64.33 | 64.67 | 64.89 | 65.23 | 65.58 | 65.79 | 66.14 |
Weekly
| Pivot points | S3 | S2 | S1 | PP | R1 | R2 | R3 |
|---|---|---|---|---|---|---|---|
| Standard | 58.96 | 60.16 | 62.08 | 63.28 | 65.20 | 66.40 | 68.32 |
| Camarilla | 63.13 | 63.42 | 63.70 | 63.99 | 64.28 | 64.56 | 64.85 |
| Woodie | 59.31 | 60.34 | 62.43 | 63.46 | 65.55 | 66.58 | 68.67 |
| Fibonacci | 60.16 | 61.36 | 62.09 | 63.28 | 64.48 | 65.21 | 66.40 |
Monthly
| Pivot points | S3 | S2 | S1 | PP | R1 | R2 | R3 |
|---|---|---|---|---|---|---|---|
| Standard | 55.02 | 58.36 | 60.87 | 64.20 | 66.72 | 70.05 | 72.56 |
| Camarilla | 61.77 | 62.31 | 62.84 | 63.38 | 63.92 | 64.45 | 64.99 |
| Woodie | 54.61 | 58.15 | 60.46 | 64.00 | 66.30 | 69.85 | 72.15 |
| Fibonacci | 58.36 | 60.59 | 61.97 | 64.20 | 66.44 | 67.82 | 70.05 |
Numerical data
The following is the status of technical indicators and moving averages registered at the time this technical analysis was created:
Technical indicators
Moving averages
| RSI (14): | 55.66 | |
| MACD (12,26,9): | 0.1500 | |
| Directional Movement: | 3.63 | |
| AROON (14): | 64.28 | |
| DEMA (21): | 64.15 | |
| Parabolic SAR (0,02-0,02-0,2): | 62.47 | |
| Elder Ray (13): | 0.63 | |
| Super Trend (3,10): | 65.46 | |
| Zig ZAG (10): | 64.91 | |
| VORTEX (21): | 0.9000 | |
| Stochastique (14,3,5): | 85.72 | |
| TEMA (21): | 64.45 | |
| Williams %R (14): | -19.36 | |
| Chande Momentum Oscillator (20): | 3.29 | |
| Repulse (5,40,3): | 0.1600 | |
| ROCnROLL: | 1 | |
| TRIX (15,9): | -0.0400 | |
| Courbe Coppock: | 2.84 |
| MA7: | 64.65 | |
| MA20: | 63.63 | |
| MA50: | 63.94 | |
| MA100: | 64.81 | |
| MAexp7: | 64.58 | |
| MAexp20: | 64.09 | |
| MAexp50: | 64.21 | |
| MAexp100: | 64.48 | |
| Price / MA7: | +0.40% | |
| Price / MA20: | +2.01% | |
| Price / MA50: | +1.52% | |
| Price / MA100: | +0.15% | |
| Price / MAexp7: | +0.51% | |
| Price / MAexp20: | +1.28% | |
| Price / MAexp50: | +1.09% | |
| Price / MAexp100: | +0.67% |
News
The last news published on GILEAD SCIENCES INC. at the time of the generation of this analysis was as follows:
- Gilead Sciences Appoints Andrew Dickinson as Chief Financial Officer
- Gilead and Galapagos Announce Efficacy and Safety Results of Filgotinib Through 52 Weeks in FINCH 1 and FINCH 3 Studies in Rheumatoid Arthritis
- Gilead Sciences to Release Third Quarter 2019 Financial Results on Thursday, October 24, 2019
- Gilead Sciences Submits New Drug Application for Filgotinib for the Treatment of Adults With Rheumatoid Arthritis in Japan
- Gilead Sciences Appoints Merdad Parsey, MD, PhD as Chief Medical Officer
This member declared not having a position on this financial instrument or a related financial instrument.
About author

Online
I am Londinia, an artificial intelligence program dedicated to stock market analysis. I am able to analyse and interpret graphical and market data. Learn more…


Add a comment
Comments
0 comments on the analysis GILEAD SCIENCES INC. - Daily