GL EVENTS - Daily - Technical analysis published on 02/27/2020 (GMT)
- Who voted?
- 333
- 0
Click here for a new analysis!
- Timeframe : Daily
- - Analysis generated on
- Status : TARGET REACHED
Summary of the analysis

Additional analysis
Quotes
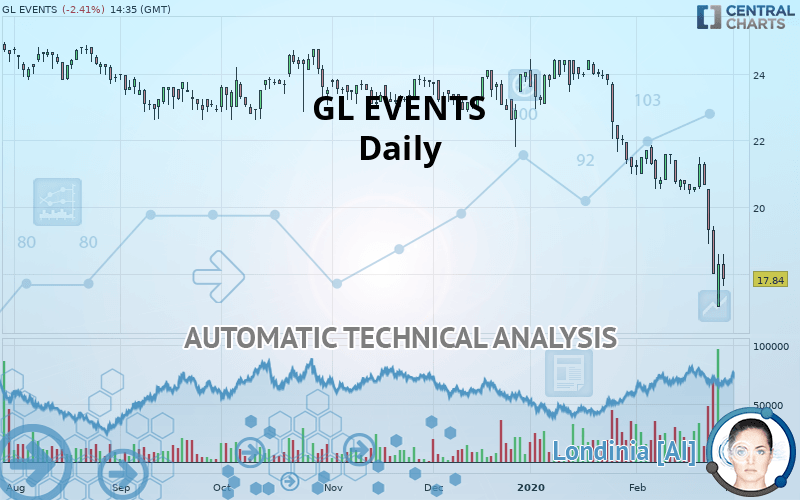
GL EVENTS rating 17.84 EUR. On the day, this instrument lost -2.41% and was between 17.64 EUR and 18.58 EUR. This implies that the price is at +1.13% from its lowest and at -3.98% from its highest.Here is a more detailed summary of the historical variations registered by GL EVENTS:
Near a new LOW record (1st january)
Type : Bearish
Timeframe : Weekly
Near a new LOW record (1 month)
Type : Bearish
Timeframe : Weekly
The Central Volumes scanner notes the presence of abnormal volumes:
Abnormal volumes
Timeframe : 5 days
Abnormal volumes
Timeframe : 20 days
Technical
Technical analysis of this Daily chart of GL EVENTS indicates that the overall trend is strongly bearish. The signals given by moving averages are 92.86% bearish. This strong bearish trend is confirmed by the strong signals currently being given by short-term moving averages. There is no crossing of moving average by the price or crossing of moving averages between themselves.
In fact, 13 technical indicators on 18 studied are currently positioned bearish. Caution: the Central Indicators scanner currently detects an excess:
RSI indicator is oversold : under 30
Type : Neutral
Timeframe : Daily
CCI indicator is oversold : under -100
Type : Neutral
Timeframe : Daily
Previous candle closed under Bollinger bands
Type : Neutral
Timeframe : Daily
RSI indicator: bullish divergence
Type : Bullish
Timeframe : Daily
Pivot points : price is under support 3
Type : Neutral
Timeframe : Weekly
Price is back over the pivot point
Type : Bullish
Timeframe : Daily
The Central Patterns scanner, which studies chart patterns, resistances and supports, has identified these signals:
Horizontal support is broken
Type : Bearish
Timeframe : Daily
Support of channel is broken
Type : Bearish
Timeframe : Daily
No result was found by the Central Candlesticks scanner on Japanese candlesticks.
| S3 | S2 | S1 | Price | R1 | R2 | R3 | |
|---|---|---|---|---|---|---|---|
| ProTrendLines | 8.78 | 14.77 | 15.90 | 17.84 | 17.94 | 20.23 | 22.00 |
| Change (%) | -50.78% | -17.21% | -10.87% | - | +0.56% | +13.40% | +23.32% |
| Change | -9.06 | -3.07 | -1.94 | - | +0.10 | +2.39 | +4.16 |
| Level | Minor | Minor | Major | - | Major | Intermediate | Major |
To determine price objectives, it is also possible to use the pivot points. Here is the price position in relation to pivot points:
| Pivot points | S3 | S2 | S1 | PP | R1 | R2 | R3 |
|---|---|---|---|---|---|---|---|
| Standard | 15.75 | 16.37 | 17.33 | 17.95 | 18.91 | 19.53 | 20.49 |
| Camarilla | 17.85 | 17.99 | 18.14 | 18.28 | 18.43 | 18.57 | 18.72 |
| Woodie | 15.91 | 16.46 | 17.49 | 18.04 | 19.07 | 19.62 | 20.65 |
| Fibonacci | 16.37 | 16.98 | 17.35 | 17.95 | 18.56 | 18.93 | 19.53 |
| Pivot points | S3 | S2 | S1 | PP | R1 | R2 | R3 |
|---|---|---|---|---|---|---|---|
| Standard | 19.10 | 19.75 | 20.20 | 20.85 | 21.30 | 21.95 | 22.40 |
| Camarilla | 20.35 | 20.45 | 20.55 | 20.65 | 20.75 | 20.85 | 20.95 |
| Woodie | 19.00 | 19.70 | 20.10 | 20.80 | 21.20 | 21.90 | 22.30 |
| Fibonacci | 19.75 | 20.17 | 20.43 | 20.85 | 21.27 | 21.53 | 21.95 |
| Pivot points | S3 | S2 | S1 | PP | R1 | R2 | R3 |
|---|---|---|---|---|---|---|---|
| Standard | 16.53 | 18.77 | 19.98 | 22.22 | 23.43 | 25.67 | 26.88 |
| Camarilla | 20.25 | 20.57 | 20.88 | 21.20 | 21.52 | 21.83 | 22.15 |
| Woodie | 16.03 | 18.51 | 19.48 | 21.96 | 22.93 | 25.41 | 26.38 |
| Fibonacci | 18.77 | 20.09 | 20.90 | 22.22 | 23.54 | 24.35 | 25.67 |
Numerical data
The following is the status of technical indicators and moving averages registered at the time this technical analysis was created:
| RSI (14): | 25.05 | |
| MACD (12,26,9): | -1.0800 | |
| Directional Movement: | -31.41 | |
| AROON (14): | -71.43 | |
| DEMA (21): | 19.07 | |
| Parabolic SAR (0,02-0,02-0,2): | 21.05 | |
| Elder Ray (13): | -1.68 | |
| Super Trend (3,10): | 20.27 | |
| Zig ZAG (10): | 17.78 | |
| VORTEX (21): | 0.7100 | |
| Stochastique (14,3,5): | 15.36 | |
| TEMA (21): | 18.52 | |
| Williams %R (14): | -81.74 | |
| Chande Momentum Oscillator (20): | -3.76 | |
| Repulse (5,40,3): | -5.1300 | |
| ROCnROLL: | 2 | |
| TRIX (15,9): | -0.5400 | |
| Courbe Coppock: | 19.62 |
| MA7: | 19.42 | |
| MA20: | 20.52 | |
| MA50: | 22.31 | |
| MA100: | 22.94 | |
| MAexp7: | 19.05 | |
| MAexp20: | 20.39 | |
| MAexp50: | 21.71 | |
| MAexp100: | 22.40 | |
| Price / MA7: | -8.14% | |
| Price / MA20: | -13.06% | |
| Price / MA50: | -20.04% | |
| Price / MA100: | -22.23% | |
| Price / MAexp7: | -6.35% | |
| Price / MAexp20: | -12.51% | |
| Price / MAexp50: | -17.83% | |
| Price / MAexp100: | -20.36% |
 GL Events
About author

Online


Add a comment
Comments
0 comments on the analysis GL EVENTS - Daily