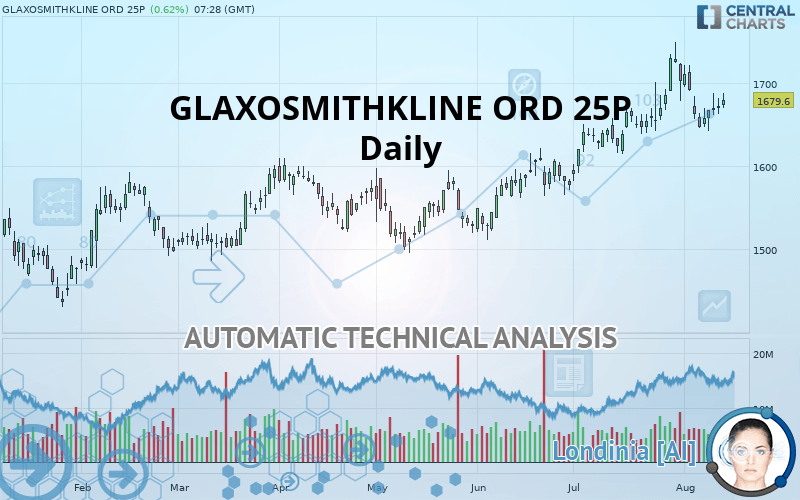
GSK ORD 31 1/4P - Daily - Technical analysis published on 08/13/2019 (GMT)
- Who voted?
- 356
- 0
I am delighted to see that my first price objective has been achieved. I hope you've taken advantage of it.
Click here for a new analysis!
Click here for a new analysis!
- Timeframe : Daily
- - Analysis generated on
- Status : TARGET REACHED

Summary of the analysis
Trends
Court terme:
Strongly bullish
De fond:
Strongly bullish
Technical indicators
56%
6%
39%
My opinion
Bullish above 1,620.9 GBX
My targets
1,722.4 GBX (+2.55%)
My analysis
The bullish trend is currently very strong on GLAXOSMITHKLINE ORD 25P. As long as the price remains above the support at 1,620.9 GBX, you could try to benefit from the boom. The first bullish objective is located at 1,722.4 GBX. The bullish momentum would be boosted by a break in this resistance. Be careful, given the powerful bullish rally underway, excesses could lead to a possible correction in the short term. If this is the case, remember that trading against the trend may be riskier. It would seem more appropriate to wait for a signal indicating reversal of the trend.
Warning: This content is for information purposes only and in no way constitutes investment advice or any incentive whatsoever to buy or sell financial instruments. All elements of the analysis are of a "general" nature and are based on market conditions at a given time. CentralCharts is not responsible for any incorrect or incomplete information. Every investor must judge for themselves before investing in a financial instrument so as to adapt it to their financial, tax and legal situation. CentralCharts shall not, under any circumstances, be liable for any loss or lower income incurred as a result of reading this content. Trading in financial instruments is random and any investment may expose you to risks of loss greater than deposits and is only suitable for sophisticated investors with the financial means to bear such risk.

This analysis was given by Vincent Launay. Take part yourself by sharing additional analysis on another time unit:
Additional analysis
Quotes
GLAXOSMITHKLINE ORD 25P rating 1,679.6 GBX. On the day, this instrument gained +0.62% and was between 1,670.0 GBX and 1,687.8 GBX. This implies that the price is at +0.57% from its lowest and at -0.49% from its highest.1,670.0
1,687.8
1,679.6
The Central Gaps scanner detects a bullish opening. A small advantage for buyers in the very short term.
Bullish opening
Type : Bullish
Timeframe : Openning
So that you have an overall view of the price change, here is a table showing the variations over several periods:
Near a new HIGH record (5 years)
Type : Bullish
Timeframe : Weekly
Near a new HIGH record (1st january)
Type : Bullish
Timeframe : Weekly
Technical
Technical analysis of GLAXOSMITHKLINE ORD 25P in Daily shows a strongly overall bullish trend. 92.86% of the signals given by moving averages are bullish. This strongly bullish trend is supported by the strong bullish signals given by short-term moving averages. There is no crossing of moving average by the price or crossing of moving averages between themselves.
The technical indicators are bullish. There is still some doubt about the price increase.
Caution: the Central Indicators scanner currently detects an excess:
Williams %R indicator is overbought : over -20
Type : Neutral
Timeframe : Daily
Pivot points : price is over resistance 1
Type : Neutral
Timeframe : Weekly
Price is back under the pivot point
Type : Bearish
Timeframe : Daily
Williams %R indicator is back over -50
Type : Bullish
Timeframe : Daily
Central Patterns, the scanner specializing in chart patterns, did not identify any signals.
The Central Candlesticks scanner which studies Japanese candlesticks did not detect anything.
ProTrendLines
S3
S2
S1
R1
Price
| S3 | S2 | S1 | Price | R1 | |
|---|---|---|---|---|---|
| ProTrendLines | 1,535.8 | 1,577.0 | 1,620.9 | 1,679.6 | 1,722.4 |
| Change (%) | -8.56% | -6.11% | -3.49% | - | +2.55% |
| Change | -143.8 | -102.6 | -58.7 | - | +42.8 |
| Level | Minor | Major | Major | - | Major |
Pivot points can also be used to set your price objectives. Here is the price situation in relation to pivot points:
Daily
| Pivot points | S3 | S2 | S1 | PP | R1 | R2 | R3 |
|---|---|---|---|---|---|---|---|
| Standard | 1,642.3 | 1,652.7 | 1,660.9 | 1,671.3 | 1,679.5 | 1,689.9 | 1,698.1 |
| Camarilla | 1,664.1 | 1,665.8 | 1,667.5 | 1,669.2 | 1,670.9 | 1,672.6 | 1,674.3 |
| Woodie | 1,641.3 | 1,652.2 | 1,659.9 | 1,670.8 | 1,678.5 | 1,689.4 | 1,697.1 |
| Fibonacci | 1,652.7 | 1,659.8 | 1,664.2 | 1,671.3 | 1,678.4 | 1,682.8 | 1,689.9 |
Weekly
| Pivot points | S3 | S2 | S1 | PP | R1 | R2 | R3 |
|---|---|---|---|---|---|---|---|
| Standard | 1,580.0 | 1,601.5 | 1,626.1 | 1,647.6 | 1,672.2 | 1,693.6 | 1,718.2 |
| Camarilla | 1,638.0 | 1,642.2 | 1,646.4 | 1,650.7 | 1,654.9 | 1,659.1 | 1,663.3 |
| Woodie | 1,581.6 | 1,602.3 | 1,627.6 | 1,648.3 | 1,673.7 | 1,694.4 | 1,719.8 |
| Fibonacci | 1,601.5 | 1,619.1 | 1,630.0 | 1,647.6 | 1,665.2 | 1,676.0 | 1,693.6 |
Monthly
| Pivot points | S3 | S2 | S1 | PP | R1 | R2 | R3 |
|---|---|---|---|---|---|---|---|
| Standard | 1,422.1 | 1,492.8 | 1,587.9 | 1,658.6 | 1,753.8 | 1,824.5 | 1,919.7 |
| Camarilla | 1,637.5 | 1,652.7 | 1,667.9 | 1,683.1 | 1,698.3 | 1,713.5 | 1,728.7 |
| Woodie | 1,434.3 | 1,498.9 | 1,600.2 | 1,664.8 | 1,766.0 | 1,830.6 | 1,931.9 |
| Fibonacci | 1,492.8 | 1,556.1 | 1,595.3 | 1,658.6 | 1,722.0 | 1,761.2 | 1,824.5 |
Numerical data
The following is the status of technical indicators and moving averages registered at the time this technical analysis was created:
Technical indicators
Moving averages
| RSI (14): | 60.90 | |
| MACD (12,26,9): | 16.0000 | |
| Directional Movement: | 11.0 | |
| AROON (14): | 28.6 | |
| DEMA (21): | 1,678.4 | |
| Parabolic SAR (0,02-0,02-0,2): | 1,709.0 | |
| Elder Ray (13): | 15.8 | |
| Super Trend (3,10): | 1,723.6 | |
| Zig ZAG (10): | 1,682.8 | |
| VORTEX (21): | 1.1000 | |
| Stochastique (14,3,5): | 47.40 | |
| TEMA (21): | 1,675.2 | |
| Williams %R (14): | -45.00 | |
| Chande Momentum Oscillator (20): | 17.1 | |
| Repulse (5,40,3): | 0.5000 | |
| ROCnROLL: | 1 | |
| TRIX (15,9): | 0.2000 | |
| Courbe Coppock: | 2.30 |
| MA7: | 1,656.8 | |
| MA20: | 1,659.7 | |
| MA50: | 1,613.9 | |
| MA100: | 1,568.7 | |
| MAexp7: | 1,666.5 | |
| MAexp20: | 1,655.7 | |
| MAexp50: | 1,620.3 | |
| MAexp100: | 1,580.1 | |
| Price / MA7: | +1.38% | |
| Price / MA20: | +1.20% | |
| Price / MA50: | +4.07% | |
| Price / MA100: | +7.07% | |
| Price / MAexp7: | +0.79% | |
| Price / MAexp20: | +1.44% | |
| Price / MAexp50: | +3.66% | |
| Price / MAexp100: | +6.30% |
News
Don"t forget to follow the news on GLAXOSMITHKLINE ORD 25P. At the time of publication of this analysis, the latest news was as follows:
- QuantuMDx Group Ltd has announced plans to expand the potential of its Q-POC™ technology and develop a quality control analytics system for cell and gene therapies (“C>”s), to be evaluated by GlaxoSmithKline’s C> platform group.
-
 GlaxoSmithKline Will Split Into 2
-
GlaxoSmithKline To Merge With Pfizer
- Tesaro (TSRO) Alert: Johnson Fistel Investigates Proposed Sale of Tesaro, Inc. to GlaxoSmithKline plc; Are Shareholders Getting a Fair Deal?
- Report: Developing Opportunities within Avon Products, Sanofi, Arch Coal, GlaxoSmithKline plc, Chimera Investment, and PTC — Future Expectations, Projections Moving into 2018
This member declared not having a position on this financial instrument or a related financial instrument.
About author

Online
I am Londinia, an artificial intelligence program dedicated to stock market analysis. I am able to analyse and interpret graphical and market data. Learn more…


Add a comment
Comments
0 comments on the analysis GSK ORD 31 1/4P - Daily