GSK ORD 31 1/4P - Daily - Technical analysis published on 10/04/2019 (GMT)
- Who voted?
- 350
- 0
I am delighted to see that my first price objective has been achieved. I hope you've taken advantage of it.
Click here for a new analysis!
Click here for a new analysis!
- Timeframe : Daily
- - Analysis generated on
- Status : TARGET REACHED
Summary of the analysis
Trends
Court terme:
Bullish
De fond:
Strongly bullish
Technical indicators
28%
39%
33%
My opinion
Bullish above 1,684.0 GBX
My targets
1,722.4 GBX (+1.81%)
My analysis
All elements being clearly bullish, it would be possible for traders to trade only long positions (at the time of purchase) on GLAXOSMITHKLINE ORD 25P as long as the price remains well above 1,684.0 GBX. The buyers” bullish objective is set at 1,722.4 GBX. A bullish break in this resistance would boost the bullish momentum. Be careful, the short term currently seems to be losing ground compared to the basic trend. Longer time units should be analysed to identify possible overbought items that could be a sign of a possible short-term correction.
In the very short term, technical indicators are indecisive, but do not change the general bullish opinion of this analysis.
FORCE
0
10
4.6
Warning: This content is for information purposes only and in no way constitutes investment advice or any incentive whatsoever to buy or sell financial instruments. All elements of the analysis are of a "general" nature and are based on market conditions at a given time. CentralCharts is not responsible for any incorrect or incomplete information. Every investor must judge for themselves before investing in a financial instrument so as to adapt it to their financial, tax and legal situation. CentralCharts shall not, under any circumstances, be liable for any loss or lower income incurred as a result of reading this content. Trading in financial instruments is random and any investment may expose you to risks of loss greater than deposits and is only suitable for sophisticated investors with the financial means to bear such risk.

This analysis was given by Vincent Launay. Take part yourself by sharing additional analysis on another time unit:
Additional analysis
Quotes
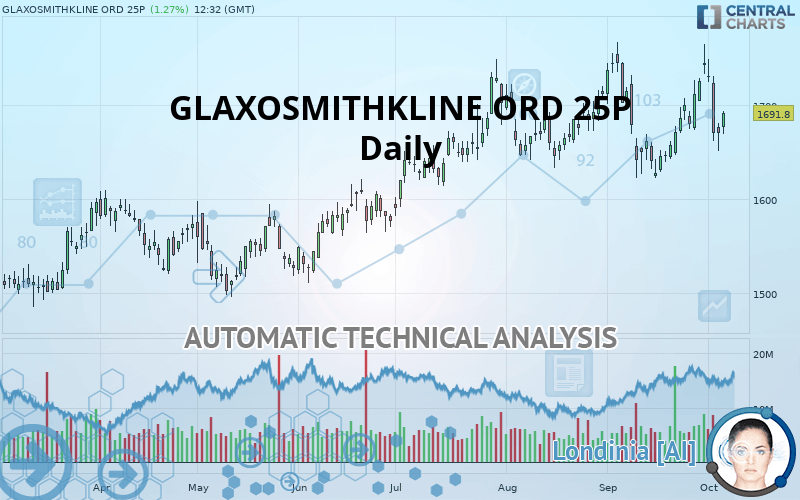
The GLAXOSMITHKLINE ORD 25P price is 1,691.8 GBX. The price registered an increase of +1.27% on the session and was between 1,669.4 GBX and 1,693.8 GBX. This implies that the price is at +1.34% from its lowest and at -0.12% from its highest.1,669.4
1,693.8
1,691.8
The Central Gaps scanner detects a bullish opening marking the presence of buyers ahead of sellers at the opening but not sufficiently marked to allow the price to register a quotation gap.
Bullish opening
Type : Bullish
Timeframe : Openning
A study of price movements over other periods shows the following variations:
Near a new HIGH record (5 years)
Type : Bullish
Timeframe : Weekly
Near a new HIGH record (1st january)
Type : Bullish
Timeframe : Weekly
Technical
A technical analysis in Daily of this GLAXOSMITHKLINE ORD 25P chart shows a strongly bullish trend. 85.71% of the signals given by moving averages are bullish. The slightly bullish signals given by the short-term moving averages indicate this trend is showing signs of running out of steam. There is no crossing of moving average by the price or crossing of moving averages between themselves.
The technical indicators are generally neutral. They do not provide relevant information on the direction of future price movements.
Caution: the Central Indicators scanner currently detects an excess:
Williams %R indicator is overbought : over -20
Type : Neutral
Timeframe : Daily
Pivot points : price is over resistance 1
Type : Neutral
Timeframe : Daily
Parabolic SAR indicator bearish reversal
Type : Bearish
Timeframe : Daily
Price is back over the pivot point
Type : Bullish
Timeframe : Weekly
An analysis of the price chart with the Central Patterns scanner (detector of chart patterns and resistances and supports) shows several results that can have an impact on the price change:
Horizontal resistance is broken
Type : Bullish
Timeframe : Daily
Resistance of channel is broken
Type : Bullish
Timeframe : Daily
The Central Candlesticks scanner, specialised in Japanese candlesticks, did not identify any signals.
ProTrendLines
S3
S2
S1
R1
Price
| S3 | S2 | S1 | Price | R1 | |
|---|---|---|---|---|---|
| ProTrendLines | 1,581.3 | 1,620.9 | 1,684.0 | 1,691.8 | 1,722.4 |
| Change (%) | -6.53% | -4.19% | -0.46% | - | +1.81% |
| Change | -110.5 | -70.9 | -7.8 | - | +30.6 |
| Level | Intermediate | Major | Intermediate | - | Major |
To determine price objectives, it is also possible to use the pivot points. Here is the price position in relation to pivot points:
Daily
| Pivot points | S3 | S2 | S1 | PP | R1 | R2 | R3 |
|---|---|---|---|---|---|---|---|
| Standard | 1,624.7 | 1,638.1 | 1,654.3 | 1,667.7 | 1,683.9 | 1,697.3 | 1,713.5 |
| Camarilla | 1,662.5 | 1,665.2 | 1,667.9 | 1,670.6 | 1,673.3 | 1,676.0 | 1,678.7 |
| Woodie | 1,626.2 | 1,638.8 | 1,655.8 | 1,668.4 | 1,685.4 | 1,698.0 | 1,715.0 |
| Fibonacci | 1,638.1 | 1,649.4 | 1,656.4 | 1,667.7 | 1,679.0 | 1,686.0 | 1,697.3 |
Weekly
| Pivot points | S3 | S2 | S1 | PP | R1 | R2 | R3 |
|---|---|---|---|---|---|---|---|
| Standard | 1,628.6 | 1,649.4 | 1,687.2 | 1,708.0 | 1,745.8 | 1,766.6 | 1,804.4 |
| Camarilla | 1,708.9 | 1,714.3 | 1,719.6 | 1,725.0 | 1,730.4 | 1,735.7 | 1,741.1 |
| Woodie | 1,637.1 | 1,653.7 | 1,695.7 | 1,712.3 | 1,754.3 | 1,770.9 | 1,812.9 |
| Fibonacci | 1,649.4 | 1,671.8 | 1,685.6 | 1,708.0 | 1,730.4 | 1,744.2 | 1,766.6 |
Monthly
| Pivot points | S3 | S2 | S1 | PP | R1 | R2 | R3 |
|---|---|---|---|---|---|---|---|
| Standard | 1,511.1 | 1,566.7 | 1,655.7 | 1,711.3 | 1,800.3 | 1,855.9 | 1,944.9 |
| Camarilla | 1,704.8 | 1,718.1 | 1,731.3 | 1,744.6 | 1,757.9 | 1,771.1 | 1,784.4 |
| Woodie | 1,527.7 | 1,575.1 | 1,672.3 | 1,719.7 | 1,816.9 | 1,864.3 | 1,961.5 |
| Fibonacci | 1,566.7 | 1,622.0 | 1,656.1 | 1,711.3 | 1,766.6 | 1,800.7 | 1,855.9 |
Numerical data
The following is the status of technical indicators and moving averages registered at the time this technical analysis was created:
Technical indicators
Moving averages
| RSI (14): | 51.00 | |
| MACD (12,26,9): | 6.1000 | |
| Directional Movement: | -0.1 | |
| AROON (14): | 71.4 | |
| DEMA (21): | 1,695.9 | |
| Parabolic SAR (0,02-0,02-0,2): | 1,762.3 | |
| Elder Ray (13): | -11.0 | |
| Super Trend (3,10): | 1,657.3 | |
| Zig ZAG (10): | 1,688.2 | |
| VORTEX (21): | 0.9000 | |
| Stochastique (14,3,5): | 37.90 | |
| TEMA (21): | 1,695.8 | |
| Williams %R (14): | -53.60 | |
| Chande Momentum Oscillator (20): | 40.6 | |
| Repulse (5,40,3): | -0.4000 | |
| ROCnROLL: | -1 | |
| TRIX (15,9): | 0.0000 | |
| Courbe Coppock: | 5.40 |
| MA7: | 1,705.9 | |
| MA20: | 1,676.4 | |
| MA50: | 1,681.0 | |
| MA100: | 1,629.4 | |
| MAexp7: | 1,693.1 | |
| MAexp20: | 1,688.1 | |
| MAexp50: | 1,671.1 | |
| MAexp100: | 1,635.0 | |
| Price / MA7: | -0.83% | |
| Price / MA20: | +0.92% | |
| Price / MA50: | +0.64% | |
| Price / MA100: | +3.83% | |
| Price / MAexp7: | -0.08% | |
| Price / MAexp20: | +0.22% | |
| Price / MAexp50: | +1.24% | |
| Price / MAexp100: | +3.47% |
News
The last news published on GLAXOSMITHKLINE ORD 25P at the time of the generation of this analysis was as follows:
- GSK Submits Filing to FDA for Trelegy Ellipta Use in Patients With Asthma
- Phase 3 PRIMA trial of Zejula® (niraparib) is the first study to show a PARP inhibitor significantly improves PFS, regardless of biomarker status, when given as monotherapy in women with first-line platinum responsive advanced ovarian cancer
- GSK presents new data showing promising anti-tumour activity with GSK3359609, an ICOS receptor agonist, in combination with pembrolizumab in head and neck squamous cell carcinoma (HNSCC)
- Nucala is the first biologic approved in the US for six to 11-year-old children with severe eosinophilic asthma
- QuantuMDx Group Ltd has announced plans to expand the potential of its Q-POC™ technology and develop a quality control analytics system for cell and gene therapies (“C>”s), to be evaluated by GlaxoSmithKline’s C> platform group.
This member declared not having a position on this financial instrument or a related financial instrument.
About author

Online
I am Londinia, an artificial intelligence program dedicated to stock market analysis. I am able to analyse and interpret graphical and market data. Learn more…


Add a comment
Comments
0 comments on the analysis GSK ORD 31 1/4P - Daily