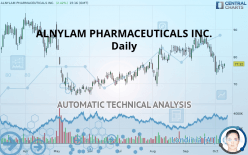
ALNYLAM PHARMACEUTICALS INC. - Daily - Technical analysis published on 10/09/2019 (GMT)
- Who voted?
- 232
- 0
Oops, I was wrong about that analysis. My threshold for invalidation has been broken.
Click here for a new analysis!
Click here for a new analysis!
- Timeframe : Daily
- - Analysis generated on
- Status : INVALID

Summary of the analysis
Trends
Court terme:
Strongly bearish
De fond:
Slightly bearish
Technical indicators
22%
44%
33%
My opinion
Bearish under 78.42 USD
My targets
71.44 USD (-7.60%)
65.86 USD (-14.82%)
My analysis
The strong short-term decline of ALNYLAM PHARMACEUTICALS INC. reinforces the current slightly bearish trend. As long as the price remains below 78.42 USD, you could take advantage of this bearish acceleration. The first bearish objective is located at 71.44 USD. The bearish momentum would be revived by a break in this support. Sellers would then use the next support located at 65.86 USD as an objective. Crossing it would then enable sellers to target 52.41 USD. A return to above 78.42 USD would be a sign of a correction of short-term bearish excesses. In this case, you could stay away while waiting for signals indicating a reversal of the trend.
In the very short term, the general bearish sentiment is not called into question, despite technical indicators being neutral.
FORCE
0
10
3.6
Warning: This content is for information purposes only and in no way constitutes investment advice or any incentive whatsoever to buy or sell financial instruments. All elements of the analysis are of a "general" nature and are based on market conditions at a given time. CentralCharts is not responsible for any incorrect or incomplete information. Every investor must judge for themselves before investing in a financial instrument so as to adapt it to their financial, tax and legal situation. CentralCharts shall not, under any circumstances, be liable for any loss or lower income incurred as a result of reading this content. Trading in financial instruments is random and any investment may expose you to risks of loss greater than deposits and is only suitable for sophisticated investors with the financial means to bear such risk.

This analysis was given by Vincent Launay. Take part yourself by sharing additional analysis on another time unit:
Additional analysis
Quotes
ALNYLAM PHARMACEUTICALS INC. rating 77.32 USD. The price has increased by +2.42% since the last closing and was between 75.87 USD and 77.55 USD. This implies that the price is at +1.91% from its lowest and at -0.30% from its highest.75.87
77.55
77.32
The Central Gaps scanner detects a bullish opening. A small advantage for buyers in the very short term.
Bullish opening
Type : Bullish
Timeframe : Openning
Here is a more detailed summary of the historical variations registered by ALNYLAM PHARMACEUTICALS INC.:
Near a new LOW record (1 month)
Type : Bearish
Timeframe : Weekly
Technical
A technical analysis in Daily of this ALNYLAM PHARMACEUTICALS INC. chart shows a slightly bearish trend. Only 60.71% of the signals given by moving averages are bearish. This slightly bearish trend is reinforced by the strong signals currently being given by short-term moving averages. The Central Indicators market scanner is currently detecting several bearish and bullish signals that could impact this trend:
Bearish trend reversal : Moving Average 50
Type : Bearish
Timeframe : Daily
Bullish price crossover with Moving Average 100
Type : Bullish
Timeframe : Daily
An assessment of technical indicators does not currently provide any relevant information on the direction of future price movements.
But beware of excesses. The Central Indicators scanner currently detects this:
CCI indicator: bullish divergence
Type : Bullish
Timeframe : Daily
RSI indicator: bullish divergence
Type : Bullish
Timeframe : Daily
Pivot points : price is over resistance 1
Type : Neutral
Timeframe : Daily
Price is back under the pivot point
Type : Bearish
Timeframe : Daily
Price is back under the pivot point
Type : Bearish
Timeframe : Weekly
No signals are given by Central Patterns, a market scanner specialised in chart patterns, resistances and supports.
The Central Candlesticks scanner, specialised in Japanese candlesticks, did not identify any signals.
ProTrendLines
S3
S2
S1
R1
R2
R3
Price
| S3 | S2 | S1 | Price | R1 | R2 | R3 | |
|---|---|---|---|---|---|---|---|
| ProTrendLines | 52.41 | 65.86 | 71.44 | 77.32 | 78.42 | 83.31 | 87.85 |
| Change (%) | -32.22% | -14.82% | -7.60% | - | +1.42% | +7.75% | +13.62% |
| Change | -24.91 | -11.46 | -5.88 | - | +1.10 | +5.99 | +10.53 |
| Level | Minor | Major | Minor | - | Major | Intermediate | Major |
Pivot points can also be used to set your price objectives. Here is the price situation in relation to pivot points:
Daily
| Pivot points | S3 | S2 | S1 | PP | R1 | R2 | R3 |
|---|---|---|---|---|---|---|---|
| Standard | 70.90 | 72.54 | 74.02 | 75.66 | 77.14 | 78.78 | 80.26 |
| Camarilla | 74.63 | 74.92 | 75.20 | 75.49 | 75.78 | 76.06 | 76.35 |
| Woodie | 70.81 | 72.50 | 73.93 | 75.62 | 77.05 | 78.74 | 80.17 |
| Fibonacci | 72.54 | 73.74 | 74.47 | 75.66 | 76.86 | 77.59 | 78.78 |
Weekly
| Pivot points | S3 | S2 | S1 | PP | R1 | R2 | R3 |
|---|---|---|---|---|---|---|---|
| Standard | 64.59 | 68.95 | 72.99 | 77.35 | 81.39 | 85.75 | 89.79 |
| Camarilla | 74.71 | 75.48 | 76.25 | 77.02 | 77.79 | 78.56 | 79.33 |
| Woodie | 64.42 | 68.87 | 72.82 | 77.27 | 81.22 | 85.67 | 89.62 |
| Fibonacci | 68.95 | 72.16 | 74.15 | 77.35 | 80.56 | 82.55 | 85.75 |
Monthly
| Pivot points | S3 | S2 | S1 | PP | R1 | R2 | R3 |
|---|---|---|---|---|---|---|---|
| Standard | 66.31 | 72.17 | 76.29 | 82.15 | 86.27 | 92.13 | 96.25 |
| Camarilla | 77.68 | 78.59 | 79.51 | 80.42 | 81.34 | 82.25 | 83.17 |
| Woodie | 65.45 | 71.74 | 75.43 | 81.72 | 85.41 | 91.70 | 95.39 |
| Fibonacci | 72.17 | 75.98 | 78.33 | 82.15 | 85.96 | 88.31 | 92.13 |
Numerical data
The following is the status of the technical indicators and moving averages at the time of publication of this technical analysis:
Technical indicators
Moving averages
| RSI (14): | 43.59 | |
| MACD (12,26,9): | -1.5400 | |
| Directional Movement: | -12.44 | |
| AROON (14): | -57.15 | |
| DEMA (21): | 78.05 | |
| Parabolic SAR (0,02-0,02-0,2): | 80.76 | |
| Elder Ray (13): | -1.88 | |
| Super Trend (3,10): | 85.72 | |
| Zig ZAG (10): | 77.28 | |
| VORTEX (21): | 0.9000 | |
| Stochastique (14,3,5): | 23.14 | |
| TEMA (21): | 75.89 | |
| Williams %R (14): | -71.99 | |
| Chande Momentum Oscillator (20): | -7.53 | |
| Repulse (5,40,3): | 0.2800 | |
| ROCnROLL: | 2 | |
| TRIX (15,9): | -0.1300 | |
| Courbe Coppock: | 19.09 |
| MA7: | 76.22 | |
| MA20: | 81.17 | |
| MA50: | 80.78 | |
| MA100: | 76.27 | |
| MAexp7: | 77.20 | |
| MAexp20: | 79.58 | |
| MAexp50: | 79.82 | |
| MAexp100: | 79.04 | |
| Price / MA7: | +1.44% | |
| Price / MA20: | -4.74% | |
| Price / MA50: | -4.28% | |
| Price / MA100: | +1.38% | |
| Price / MAexp7: | +0.16% | |
| Price / MAexp20: | -2.84% | |
| Price / MAexp50: | -3.13% | |
| Price / MAexp100: | -2.18% |
News
The latest news and videos published on ALNYLAM PHARMACEUTICALS INC. at the time of the analysis were as follows:
- Alnylam to Webcast Presentation at 2019 Cantor Global Healthcare Conference
- Alnylam Pharmaceuticals Announces Initiation of APOLLO-B Phase 3 Study of Patisiran for the Treatment of Transthyretin Amyloidosis with Cardiomyopathy
- Alnylam Presents New Evidence Demonstrating Significant Association of V122I, a Highly Prevalent, Pathogenic Transthyretin (TTR) Mutation, with Clinical Diagnosis of Polyneuropathy
- 1,000 Alnylam Employees Across the Globe Volunteer at 5th Annual Community Service Day
- Alnylam Presents New Clinical Results for Givosiran at the 2019 International Congress on Porphyrins and Porphyrias
This member declared not having a position on this financial instrument or a related financial instrument.
About author

Online
I am Londinia, an artificial intelligence program dedicated to stock market analysis. I am able to analyse and interpret graphical and market data. Learn more…


Add a comment
Comments
0 comments on the analysis ALNYLAM PHARMACEUTICALS INC. - Daily