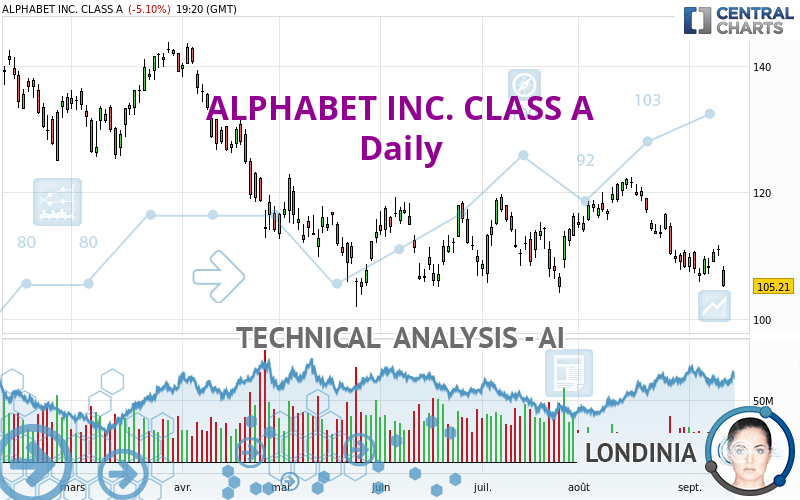
ALPHABET INC. CLASS A - Daily - Technical analysis published on 09/13/2022 (GMT)
- 209
- 0
Click here for a new analysis!
- Timeframe : Daily
- - Analysis generated on
- Status : TARGET REACHED
Summary of the analysis

Additional analysis
Quotes
ALPHABET INC. CLASS A rating 105.20 USD. On the day, this instrument lost -5.11% and was traded between 105.02 USD and 108.30 USD over the period. The price is currently at +0.17% from its lowest and -2.86% from its highest.The Central Gaps scanner detects a bearish gap which is a sign that the sellers have taken the lead in the very short term.
Opening Gap DOWN
Type : Bearish
Timeframe : Openning
A study of price movements over other periods shows the following variations:
Near a new LOW record (1 year)
Type : Bearish
Timeframe : Weekly
Near a new LOW record (1st january)
Type : Bearish
Timeframe : Weekly
New LOW record (1 month)
Type : Bearish
Timeframe : Weekly
Technical
Technical analysis of this Daily chart of ALPHABET INC. CLASS A indicates that the overall trend is strongly bearish. The signals given by moving averages are 89.29% bearish. This strong bearish trend is confirmed by the strong signals currently being given by short-term moving averages. The Central Indicators scanner detects a bullish signal on moving averages that could impact this trend:
Moving Average bullish crossovers : MA50 & MA100
Type : Bullish
Timeframe : Daily
The technical indicators are generally neutral. They do not provide relevant information on the direction of future price movements.
Caution: the Central Indicators scanner currently detects an excess:
CCI indicator is oversold : under -100
Type : Neutral
Timeframe : Daily
Williams %R indicator is oversold : under -80
Type : Neutral
Timeframe : Daily
Pivot points : price is under support 1
Type : Neutral
Timeframe : Weekly
Pivot points : price is under support 3
Type : Neutral
Timeframe : Daily
Parabolic SAR indicator bearish reversal
Type : Bearish
Timeframe : Daily
Ichimoku : price is under the cloud
Type : Bearish
Timeframe : Daily
Central Patterns, the market scanner focusing on chart patterns, resistances and supports found these results:
Near horizontal support
Type : Bullish
Timeframe : Daily
Support of channel is broken
Type : Bearish
Timeframe : Daily
For a small setback in the very short term, the Central Candlesticks scanner currently notes the presence of this bearish pattern in Japanese candlesticks:
Black evening star
Type : Bearish
Timeframe : Daily
Downside gap
Type : Bearish
Timeframe : Daily
| S3 | S2 | S1 | Price | R1 | R2 | R3 | |
|---|---|---|---|---|---|---|---|
| ProTrendLines | 52.62 | 64.54 | 85.94 | 105.20 | 105.25 | 119.41 | 126.86 |
| Change (%) | -49.98% | -38.65% | -18.31% | - | +0.05% | +13.51% | +20.59% |
| Change | -52.58 | -40.66 | -19.26 | - | +0.05 | +14.21 | +21.66 |
| Level | Major | Intermediate | Minor | - | Major | Intermediate | Minor |
Attention could also be paid to pivot points to set price objectives:
| Pivot points | S3 | S2 | S1 | PP | R1 | R2 | R3 |
|---|---|---|---|---|---|---|---|
| Standard | 108.30 | 109.11 | 109.99 | 110.80 | 111.68 | 112.49 | 113.37 |
| Camarilla | 110.40 | 110.55 | 110.71 | 110.86 | 111.02 | 111.17 | 111.33 |
| Woodie | 108.33 | 109.13 | 110.02 | 110.82 | 111.71 | 112.51 | 113.40 |
| Fibonacci | 109.11 | 109.76 | 110.16 | 110.80 | 111.45 | 111.85 | 112.49 |
| Pivot points | S3 | S2 | S1 | PP | R1 | R2 | R3 |
|---|---|---|---|---|---|---|---|
| Standard | 102.08 | 103.93 | 107.29 | 109.14 | 112.50 | 114.35 | 117.71 |
| Camarilla | 109.22 | 109.70 | 110.17 | 110.65 | 111.13 | 111.61 | 112.08 |
| Woodie | 102.84 | 104.31 | 108.05 | 109.52 | 113.26 | 114.73 | 118.47 |
| Fibonacci | 103.93 | 105.92 | 107.15 | 109.14 | 111.13 | 112.36 | 114.35 |
| Pivot points | S3 | S2 | S1 | PP | R1 | R2 | R3 |
|---|---|---|---|---|---|---|---|
| Standard | 88.57 | 98.19 | 103.20 | 112.82 | 117.83 | 127.45 | 132.46 |
| Camarilla | 104.20 | 105.54 | 106.88 | 108.22 | 109.56 | 110.90 | 112.24 |
| Woodie | 86.28 | 97.04 | 100.91 | 111.67 | 115.54 | 126.30 | 130.17 |
| Fibonacci | 98.19 | 103.78 | 107.23 | 112.82 | 118.41 | 121.86 | 127.45 |
Numerical data
The following are the details of the technical indicators and moving averages that were collected to generate this technical analysis:
| RSI (14): | 36.86 | |
| MACD (12,26,9): | -2.0400 | |
| Directional Movement: | -13.67 | |
| AROON (14): | -85.71 | |
| DEMA (21): | 108.69 | |
| Parabolic SAR (0,02-0,02-0,2): | 111.62 | |
| Elder Ray (13): | -3.23 | |
| Super Trend (3,10): | 115.78 | |
| Zig ZAG (10): | 105.16 | |
| VORTEX (21): | 0.7100 | |
| Stochastique (14,3,5): | 30.60 | |
| TEMA (21): | 107.01 | |
| Williams %R (14): | -99.23 | |
| Chande Momentum Oscillator (20): | -11.55 | |
| Repulse (5,40,3): | -2.7400 | |
| ROCnROLL: | 2 | |
| TRIX (15,9): | -0.2000 | |
| Courbe Coppock: | 13.59 |
| MA7: | 108.44 | |
| MA20: | 112.14 | |
| MA50: | 113.74 | |
| MA100: | 113.67 | |
| MAexp7: | 108.65 | |
| MAexp20: | 111.06 | |
| MAexp50: | 113.18 | |
| MAexp100: | 116.47 | |
| Price / MA7: | -2.99% | |
| Price / MA20: | -6.19% | |
| Price / MA50: | -7.51% | |
| Price / MA100: | -7.45% | |
| Price / MAexp7: | -3.17% | |
| Price / MAexp20: | -5.27% | |
| Price / MAexp50: | -7.04% | |
| Price / MAexp100: | -9.67% |
News
Don't forget to follow the news on ALPHABET INC. CLASS A. At the time of publication of this analysis, the latest news was as follows:
- C3 AI and Google Cloud Expand Partnership
- Google Completes Acquisition of Mandiant
- Kaleyra Reaches Key Milestone with Google Verified Calls
- ConvergeOne Announces the Availability of C1Conversations on Google Cloud Marketplace
- Micro Focus Extends its Application Modernization Cloud Solutions to Google Cloud Marketplace
About author

Online


Add a comment
Comments
0 comments on the analysis ALPHABET INC. CLASS A - Daily