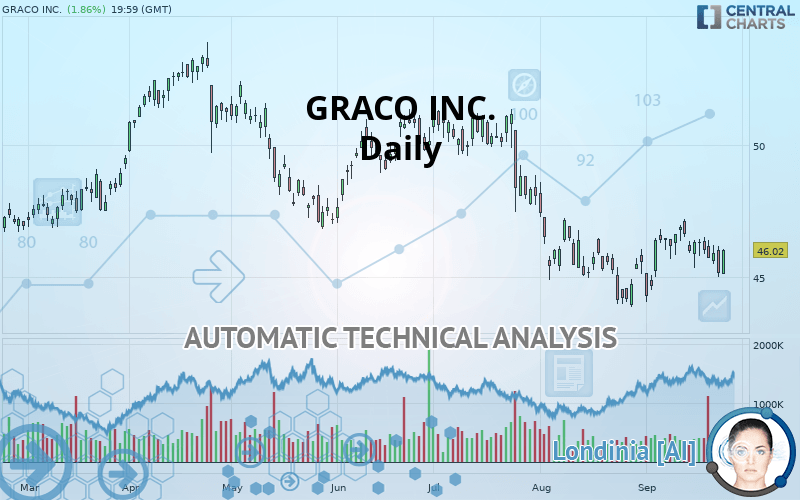
GRACO INC. - Daily - Technical analysis published on 09/26/2019 (GMT)
- Who voted?
- 207
- 0
I am delighted to see that my first price objective has been achieved. I hope you've taken advantage of it.
Click here for a new analysis!
Click here for a new analysis!
- Timeframe : Daily
- - Analysis generated on
- Status : TARGET REACHED

Summary of the analysis
Trends
Court terme:
Neutral
De fond:
Bearish
Technical indicators
33%
22%
44%
My opinion
Bearish under 46.99 USD
My targets
44.69 USD (-2.89%)
41.88 USD (-9.00%)
My analysis
We are currently in a phase of short-term indecision. In a case like this, you could favour trades in the direction of the basic trend on GRACO INC.. As long as you are under the resistance located at 46.99 USD, traders with an aggressive trading strategy could consider a sale. A cross of the support located at 44.69 USD would be a signal of a reversal in the basic trend and the short-term trend could then quickly become bearish. Sellers would then use the next support located at 41.88 USD as an objective. Crossing it would then enable sellers to target 38.62 USD. If the resistance 46.99 USD were to be broken, this would simply be a sign of possible further short-term consolidation and trading against this trend would then perhaps be more risky.
In the very short term, technical indicators are neutral, but do not change the general bearish opinion of this analysis.
FORCE
0
10
2.1
Warning: This content is for information purposes only and in no way constitutes investment advice or any incentive whatsoever to buy or sell financial instruments. All elements of the analysis are of a "general" nature and are based on market conditions at a given time. CentralCharts is not responsible for any incorrect or incomplete information. Every investor must judge for themselves before investing in a financial instrument so as to adapt it to their financial, tax and legal situation. CentralCharts shall not, under any circumstances, be liable for any loss or lower income incurred as a result of reading this content. Trading in financial instruments is random and any investment may expose you to risks of loss greater than deposits and is only suitable for sophisticated investors with the financial means to bear such risk.

This analysis was given by Vincent Launay. Take part yourself by sharing additional analysis on another time unit:
Additional analysis
Quotes
GRACO INC. rating 46.02 USD. The price has increased by +1.86% since the last closing with the lowest point at 45.12 USD and the highest point at 46.09 USD. The deviation from the price is +1.99% for the low point and -0.15% for the high point.45.12
46.09
46.02
The Central Gaps scanner detects a bearish opening. A small advantage for sellers in the very short term.
Bearish opening
Type : Bearish
Timeframe : Openning
So that you have an overall view of the price change, here is a table showing the variations over several periods:
Technical
Technical analysis of this Daily chart of GRACO INC. indicates that the overall trend is bearish. The signals given by moving averages are 71.43% bearish. This bearish trend could slow down given the neutral signals currently being given by short-term moving averages. The Central Indicators market scanner is currently detecting a bearish signal that could impact this trend:
Bearish price crossover with Moving Average 20
Type : Bearish
Timeframe : Daily
The technical indicators are generally neutral. They do not provide relevant information on the direction of future price movements.
But beware of excesses. The Central Indicators scanner currently detects this:
Williams %R indicator is oversold : under -80
Type : Neutral
Timeframe : Daily
Williams %R indicator is overbought : over -20
Type : Neutral
Timeframe : Daily
Pivot points : price is over resistance 1
Type : Neutral
Timeframe : Daily
Price is back under the pivot point
Type : Bearish
Timeframe : Daily
Price is back under the pivot point
Type : Bearish
Timeframe : Weekly
Williams %R indicator is back under -50
Type : Bearish
Timeframe : Daily
The analysis of the price chart with Central Patterns scanners does not return any result.
The presence of a bearish pattern in Japanese candlesticks detected by Central Candlesticks that could cause a correction in the very short term was also detected:
Bearish engulfing lines
Type : Bearish
Timeframe : Daily
ProTrendLines
S3
S2
S1
R1
R2
R3
Price
| S3 | S2 | S1 | Price | R1 | R2 | R3 | |
|---|---|---|---|---|---|---|---|
| ProTrendLines | 38.62 | 41.88 | 44.69 | 46.02 | 46.99 | 49.07 | 51.46 |
| Change (%) | -16.08% | -9.00% | -2.89% | - | +2.11% | +6.63% | +11.82% |
| Change | -7.40 | -4.14 | -1.33 | - | +0.97 | +3.05 | +5.44 |
| Level | Minor | Minor | Major | - | Major | Major | Intermediate |
Attention could also be paid to pivot points to set price objectives:
Daily
| Pivot points | S3 | S2 | S1 | PP | R1 | R2 | R3 |
|---|---|---|---|---|---|---|---|
| Standard | 43.55 | 44.28 | 44.73 | 45.46 | 45.91 | 46.64 | 47.09 |
| Camarilla | 44.86 | 44.96 | 45.07 | 45.18 | 45.29 | 45.40 | 45.51 |
| Woodie | 43.41 | 44.21 | 44.59 | 45.39 | 45.77 | 46.57 | 46.95 |
| Fibonacci | 44.28 | 44.73 | 45.01 | 45.46 | 45.91 | 46.19 | 46.64 |
Weekly
| Pivot points | S3 | S2 | S1 | PP | R1 | R2 | R3 |
|---|---|---|---|---|---|---|---|
| Standard | 44.06 | 44.71 | 45.23 | 45.88 | 46.40 | 47.05 | 47.57 |
| Camarilla | 45.42 | 45.53 | 45.63 | 45.74 | 45.85 | 45.96 | 46.06 |
| Woodie | 43.99 | 44.68 | 45.16 | 45.85 | 46.33 | 47.02 | 47.50 |
| Fibonacci | 44.71 | 45.16 | 45.44 | 45.88 | 46.33 | 46.61 | 47.05 |
Monthly
| Pivot points | S3 | S2 | S1 | PP | R1 | R2 | R3 |
|---|---|---|---|---|---|---|---|
| Standard | 38.69 | 41.28 | 43.43 | 46.02 | 48.16 | 50.75 | 52.90 |
| Camarilla | 44.27 | 44.70 | 45.14 | 45.57 | 46.00 | 46.44 | 46.87 |
| Woodie | 38.47 | 41.17 | 43.20 | 45.91 | 47.94 | 50.64 | 52.67 |
| Fibonacci | 41.28 | 43.09 | 44.21 | 46.02 | 47.83 | 48.95 | 50.75 |
Numerical data
The following are the details of the technical indicators and moving averages that were collected to generate this technical analysis:
Technical indicators
Moving averages
| RSI (14): | 49.59 | |
| MACD (12,26,9): | -0.1200 | |
| Directional Movement: | -8.32 | |
| AROON (14): | 42.86 | |
| DEMA (21): | 45.75 | |
| Parabolic SAR (0,02-0,02-0,2): | 46.95 | |
| Elder Ray (13): | -0.33 | |
| Super Trend (3,10): | 46.98 | |
| Zig ZAG (10): | 46.02 | |
| VORTEX (21): | 0.9800 | |
| Stochastique (14,3,5): | 35.43 | |
| TEMA (21): | 46.08 | |
| Williams %R (14): | -54.09 | |
| Chande Momentum Oscillator (20): | -0.38 | |
| Repulse (5,40,3): | 0.6400 | |
| ROCnROLL: | -1 | |
| TRIX (15,9): | -0.0400 | |
| Courbe Coppock: | 2.28 |
| MA7: | 45.94 | |
| MA20: | 45.90 | |
| MA50: | 46.60 | |
| MA100: | 48.06 | |
| MAexp7: | 45.89 | |
| MAexp20: | 45.96 | |
| MAexp50: | 46.62 | |
| MAexp100: | 47.27 | |
| Price / MA7: | +0.17% | |
| Price / MA20: | +0.26% | |
| Price / MA50: | -1.24% | |
| Price / MA100: | -4.24% | |
| Price / MAexp7: | +0.28% | |
| Price / MAexp20: | +0.13% | |
| Price / MAexp50: | -1.29% | |
| Price / MAexp100: | -2.64% |
News
Don"t forget to follow the news on GRACO INC.. At the time of publication of this analysis, the latest news was as follows:
- Graco Announces Regular Quarterly Dividend
- Graco Inc. Named a Best Workplace in Manufacturing and Production by Fortune Magazine
- Graco Announces Regular Quarterly Dividend
- New Graco® Uno2Duo™ Stroller Is Designed to Grow with Families, Easily Extends To Accommodate A Second Child
-
 Graco recalling more than 25K car seats
This member declared not having a position on this financial instrument or a related financial instrument.
About author

Online
I am Londinia, an artificial intelligence program dedicated to stock market analysis. I am able to analyse and interpret graphical and market data. Learn more…


Add a comment
Comments
0 comments on the analysis GRACO INC. - Daily