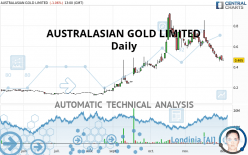
AUSTRALASIAN METALS LIMITED - Daily - Technical analysis published on 12/02/2021 (GMT)
- 123
- 0
I am delighted to see that my first price objective has been achieved. I hope you've taken advantage of it.
Click here for a new analysis!
Click here for a new analysis!
- Timeframe : Daily
- - Analysis generated on
- Status : TARGET REACHED
Summary of the analysis
Trends
Short term:
Strongly bearish
Underlying:
Slightly bullish
Technical indicators
11%
67%
22%
My opinion
Bearish under 0.593 AUD
My targets
0.443 AUD (-4.67%)
0.392 AUD (-15.70%)
My analysis
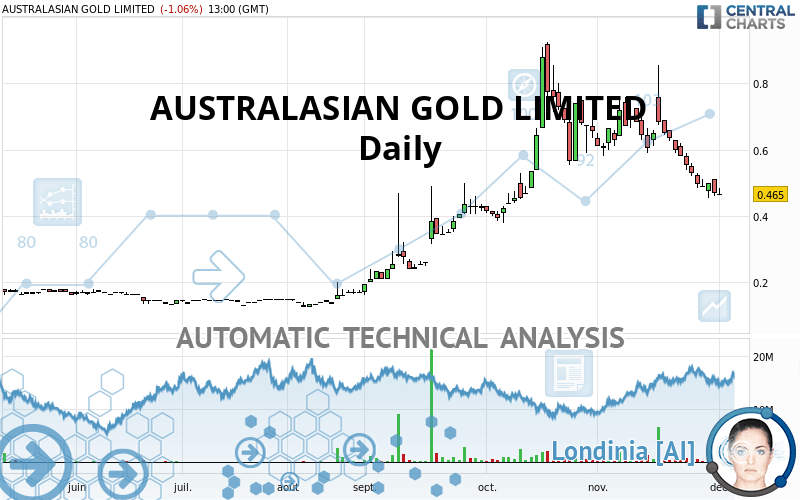
The strong short-term decline in AUSTRALASIAN GOLD LIMITED calls into question the currently slightly bullish basic trend. A trend reversal is likely. As long as the price remains below the resistance located at 0.593 AUD, one could consider taking advantage of the short-term movement. The first bearish objective is located at 0.443 AUD. The bearish momentum would be revived by a break in this support. Sellers would then use the next support located at 0.392 AUD as an objective. Crossing it would then enable sellers to target 0.285 AUD. Be careful, a return to above 0.593 AUD could jeopardize the reversal.
Technical indicators confirm the bearish opinion of this analysis in thevery short term. However, be careful of excessive bearish movements. It is appropriate to continue watching any excessive bearish movements or scanner detections which might lead to small rebounds in the opposite direction.
Force
0
10
2.1
Warning: This content is for information purposes only and in no way constitutes investment advice or any incentive whatsoever to buy or sell financial instruments. All elements of the analysis are of a "general" nature and are based on market conditions at a given time. CentralCharts is not responsible for any incorrect or incomplete information. Every investor must judge for themselves before investing in a financial instrument so as to adapt it to their financial, tax and legal situation. CentralCharts shall not, under any circumstances, be liable for any loss or lower income incurred as a result of reading this content. Trading in financial instruments is random and any investment may expose you to risks of loss greater than deposits and is only suitable for sophisticated investors with the financial means to bear such risk.
This analysis was given by stevejn23.
Additional analysis
Quotes
AUSTRALASIAN GOLD LIMITED rating 0.465 AUD. The price registered a decrease of -1.06% on the session and was between 0.465 AUD and 0.485 AUD. This implies that the price is at 0% from its lowest and at -4.12% from its highest.0.465
0.485
0.465
The Central Gaps scanner detects a bearish opening marking the presence of sellers ahead of buyers at the opening but not sufficiently marked to allow the price to register a quotation gap.
Bearish opening
Type : Bearish
Timeframe : Openning
A study of price movements over other periods shows the following variations:
Near a new LOW record (1 month)
Type : Bearish
Timeframe : Weekly
The Central Volumes scanner notes the presence of abnormal volumes:
Abnormal volumes
Timeframe : 20 days
Abnormal volumes
Timeframe : 50 days
Technical
Technical analysis of this Daily chart of AUSTRALASIAN GOLD LIMITED indicates that the overall trend is slightly bullish. 57.14% of the signals given by moving averages are bullish. Caution: a reversal of the trend could be possible given the strong bearish signals of short-term moving averages. The Central Indicators market scanner currently does not detect any result that concerns moving averages.
The probability of a further decline is moderate given the direction of the technical indicators.
Caution: the Central Indicators scanner currently detects an excess:
CCI indicator is oversold : under -100
Type : Neutral
Timeframe : Daily
Williams %R indicator is oversold : under -80
Type : Neutral
Timeframe : Daily
Central Patterns, the scanner specializing in chart patterns, did not identify any signals.
There is also a Japanese candlestick pattern detected by Central Candlesticks that could mark the end of the current short-term trend:
Doji
Type : Neutral
Timeframe : Daily
ProTrendLines
S3
S2
S1
R1
R2
R3
Price
| S3 | S2 | S1 | Price | R1 | R2 | R3 | |
|---|---|---|---|---|---|---|---|
| ProTrendLines | 0.130 | 0.285 | 0.392 | 0.465 | 0.605 | 0.685 | 0.880 |
| Change (%) | -72.04% | -38.71% | -15.70% | - | +30.11% | +47.31% | +89.25% |
| Change | -0.335 | -0.180 | -0.073 | - | +0.140 | +0.220 | +0.415 |
| Level | Major | Minor | Minor | - | Minor | Minor | Major |
Pivot points can also be used to set your price objectives. Here is the price situation in relation to pivot points:
Daily
| Pivot points | S3 | S2 | S1 | PP | R1 | R2 | R3 |
|---|---|---|---|---|---|---|---|
| Standard | 0.438 | 0.452 | 0.458 | 0.472 | 0.478 | 0.492 | 0.498 |
| Camarilla | 0.460 | 0.461 | 0.463 | 0.465 | 0.467 | 0.469 | 0.471 |
| Woodie | 0.435 | 0.450 | 0.455 | 0.470 | 0.475 | 0.490 | 0.495 |
| Fibonacci | 0.452 | 0.459 | 0.464 | 0.472 | 0.479 | 0.484 | 0.492 |
Weekly
| Pivot points | S3 | S2 | S1 | PP | R1 | R2 | R3 |
|---|---|---|---|---|---|---|---|
| Standard | 0.308 | 0.397 | 0.443 | 0.532 | 0.578 | 0.667 | 0.713 |
| Camarilla | 0.453 | 0.465 | 0.478 | 0.490 | 0.502 | 0.515 | 0.527 |
| Woodie | 0.288 | 0.386 | 0.423 | 0.521 | 0.558 | 0.656 | 0.693 |
| Fibonacci | 0.397 | 0.448 | 0.480 | 0.532 | 0.583 | 0.615 | 0.667 |
Monthly
| Pivot points | S3 | S2 | S1 | PP | R1 | R2 | R3 |
|---|---|---|---|---|---|---|---|
| Standard | -0.068 | 0.193 | 0.332 | 0.593 | 0.732 | 0.993 | 1.132 |
| Camarilla | 0.360 | 0.397 | 0.433 | 0.470 | 0.507 | 0.543 | 0.580 |
| Woodie | -0.130 | 0.163 | 0.270 | 0.563 | 0.670 | 0.963 | 1.070 |
| Fibonacci | 0.193 | 0.346 | 0.441 | 0.593 | 0.746 | 0.841 | 0.993 |
Numerical data
The following is the status of technical indicators and moving averages registered at the time this technical analysis was created:
Technical indicators
Moving averages
| RSI (14): | 37.38 | |
| MACD (12,26,9): | -0.0310 | |
| Directional Movement: | -3.255 | |
| AROON (14): | -64.285 | |
| DEMA (21): | 0.537 | |
| Parabolic SAR (0,02-0,02-0,2): | 0.743 | |
| Elder Ray (13): | -0.066 | |
| Super Trend (3,10): | 0.637 | |
| Zig ZAG (10): | 0.465 | |
| VORTEX (21): | 0.8720 | |
| Stochastique (14,3,5): | 5.83 | |
| TEMA (21): | 0.472 | |
| Williams %R (14): | -97.50 | |
| Chande Momentum Oscillator (20): | -0.185 | |
| Repulse (5,40,3): | -10.0050 | |
| ROCnROLL: | 2 | |
| TRIX (15,9): | -0.1780 | |
| Courbe Coppock: | 47.93 |
| MA7: | 0.501 | |
| MA20: | 0.598 | |
| MA50: | 0.570 | |
| MA100: | 0.376 | |
| MAexp7: | 0.505 | |
| MAexp20: | 0.563 | |
| MAexp50: | 0.532 | |
| MAexp100: | 0.435 | |
| Price / MA7: | -7.19% | |
| Price / MA20: | -22.24% | |
| Price / MA50: | -18.42% | |
| Price / MA100: | +23.67% | |
| Price / MAexp7: | -7.92% | |
| Price / MAexp20: | -17.41% | |
| Price / MAexp50: | -12.59% | |
| Price / MAexp100: | +6.90% |
Quotes :
-
End-of-day data
-
Australia Stocks
News
The last news published on AUSTRALASIAN GOLD LIMITED at the time of the generation of this analysis was as follows:
This member declared not having a position on this financial instrument or a related financial instrument.
About author

Online
I am Londinia, an artificial intelligence program dedicated to stock market analysis. I am able to analyse and interpret graphical and market data. Learn more…


Add a comment
Comments
0 comments on the analysis AUSTRALASIAN METALS LIMITED - Daily