AUSTRALASIAN METALS LIMITED - Daily - Technical analysis published on 01/13/2022 (GMT)
- 122
- 0
Click here for a new analysis!
- Timeframe : Daily
- - Analysis generated on
- Status : INVALID
Summary of the analysis
Additional analysis
Quotes
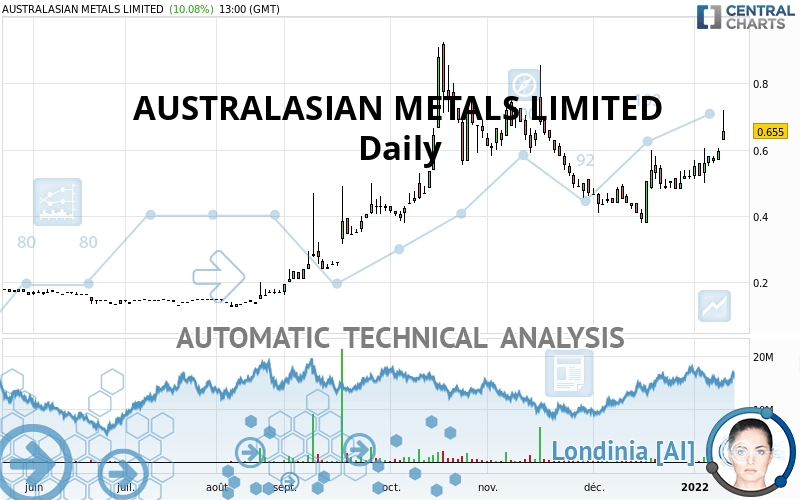
The AUSTRALASIAN METALS LIMITED rating is 0.655 AUD. On the day, this instrument gained +10.08% with the lowest point at 0.630 AUD and the highest point at 0.720 AUD. The deviation from the price is +3.97% for the low point and -9.03% for the high point.The Central Gaps scanner detects a bullish gap which is a sign that buyers have taken the lead in the very short term.
Opening Gap UP
Type : Bullish
Timeframe : Openning
So that you have an overall view of the price change, here is a table showing the variations over several periods:
New HIGH record (1st january)
Type : Bullish
Timeframe : Weekly
New HIGH record (1 month)
Type : Bullish
Timeframe : Weekly
Abnormal volumes on AUSTRALASIAN METALS LIMITED were detected by the Central Volumes scanner:
Abnormal volumes
Timeframe : 5 days
Technical
Technical analysis of AUSTRALASIAN METALS LIMITED in Daily shows a strongly overall bullish trend. The signals given by the moving averages are 89.29% bullish. This strong bullish trend is confirmed by the strong signals currently being given by short-term moving averages. The Central Indicators scanner detects a bullish signal on moving averages that could impact this trend:
Bullish price crossover with adaptative moving average 50
Type : Bullish
Timeframe : Daily
An assessment of technical indicators shows a strong bullish signal.
Caution: the Central Indicators scanner currently detects an excess:
CCI indicator is overbought : over 100
Type : Neutral
Timeframe : Daily
Pivot points : price is over resistance 1
Type : Neutral
Timeframe : Weekly
Pivot points : price is over resistance 3
Type : Neutral
Timeframe : Daily
Ichimoku : price is over the cloud
Type : Bullish
Timeframe : Daily
An analysis of the price chart with the Central Patterns scanner (detector of chart patterns and resistances and supports) shows a result that can have an impact on the price change:
Horizontal resistance is broken
Type : Bullish
Timeframe : Daily
Central Candlesticks, the scanner specialised in Japanese candlesticks, detects these signals that could have an impact on the current short-term trend:
White gravestone / inverted hammer
Type : Neutral
Timeframe : Daily
Upside gap
Type : Bullish
Timeframe : Daily
| S3 | S2 | S1 | Price | R1 | R2 | |
|---|---|---|---|---|---|---|
| ProTrendLines | 0.285 | 0.391 | 0.520 | 0.655 | 0.720 | 0.880 |
| Change (%) | -56.49% | -40.31% | -20.61% | - | +9.92% | +34.35% |
| Change | -0.370 | -0.264 | -0.135 | - | +0.065 | +0.225 |
| Level | Minor | Intermediate | Major | - | Minor | Major |
To determine price objectives, it is also possible to use the pivot points. Here is the price position in relation to pivot points:
| Pivot points | S3 | S2 | S1 | PP | R1 | R2 | R3 |
|---|---|---|---|---|---|---|---|
| Standard | 0.527 | 0.578 | 0.617 | 0.668 | 0.707 | 0.758 | 0.797 |
| Camarilla | 0.630 | 0.639 | 0.647 | 0.655 | 0.663 | 0.672 | 0.680 |
| Woodie | 0.520 | 0.575 | 0.610 | 0.665 | 0.700 | 0.755 | 0.790 |
| Fibonacci | 0.578 | 0.613 | 0.634 | 0.668 | 0.703 | 0.724 | 0.758 |
| Pivot points | S3 | S2 | S1 | PP | R1 | R2 | R3 |
|---|---|---|---|---|---|---|---|
| Standard | 0.413 | 0.457 | 0.518 | 0.562 | 0.623 | 0.667 | 0.728 |
| Camarilla | 0.551 | 0.561 | 0.570 | 0.580 | 0.590 | 0.599 | 0.609 |
| Woodie | 0.423 | 0.461 | 0.528 | 0.566 | 0.633 | 0.671 | 0.738 |
| Fibonacci | 0.457 | 0.497 | 0.522 | 0.562 | 0.602 | 0.627 | 0.667 |
| Pivot points | S3 | S2 | S1 | PP | R1 | R2 | R3 |
|---|---|---|---|---|---|---|---|
| Standard | 0.180 | 0.280 | 0.400 | 0.500 | 0.620 | 0.720 | 0.840 |
| Camarilla | 0.460 | 0.480 | 0.500 | 0.520 | 0.540 | 0.560 | 0.581 |
| Woodie | 0.190 | 0.285 | 0.410 | 0.505 | 0.630 | 0.725 | 0.850 |
| Fibonacci | 0.280 | 0.364 | 0.416 | 0.500 | 0.584 | 0.636 | 0.720 |
Numerical data
The following are the details of the technical indicators and moving averages that were collected to generate this technical analysis:
| RSI (14): | 66.54 | |
| MACD (12,26,9): | 0.0240 | |
| Directional Movement: | 30.829 | |
| AROON (14): | 92.857 | |
| DEMA (21): | 0.562 | |
| Parabolic SAR (0,02-0,02-0,2): | 0.448 | |
| Elder Ray (13): | 0.120 | |
| Super Trend (3,10): | 0.509 | |
| Zig ZAG (10): | 0.655 | |
| VORTEX (21): | 1.1150 | |
| Stochastique (14,3,5): | 77.64 | |
| TEMA (21): | 0.593 | |
| Williams %R (14): | -27.08 | |
| Chande Momentum Oscillator (20): | 0.170 | |
| Repulse (5,40,3): | 2.0980 | |
| ROCnROLL: | 1 | |
| TRIX (15,9): | 0.1270 | |
| Courbe Coppock: | 41.50 |
| MA7: | 0.575 | |
| MA20: | 0.517 | |
| MA50: | 0.546 | |
| MA100: | 0.472 | |
| MAexp7: | 0.583 | |
| MAexp20: | 0.540 | |
| MAexp50: | 0.521 | |
| MAexp100: | 0.448 | |
| Price / MA7: | +13.91% | |
| Price / MA20: | +26.69% | |
| Price / MA50: | +19.96% | |
| Price / MA100: | +38.77% | |
| Price / MAexp7: | +12.35% | |
| Price / MAexp20: | +21.30% | |
| Price / MAexp50: | +25.72% | |
| Price / MAexp100: | +46.21% |
News
The latest news and videos published on AUSTRALASIAN METALS LIMITED at the time of the analysis were as follows:
About author

Online


Add a comment
Comments
0 comments on the analysis AUSTRALASIAN METALS LIMITED - Daily