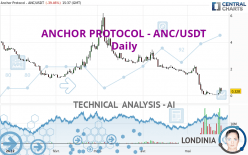
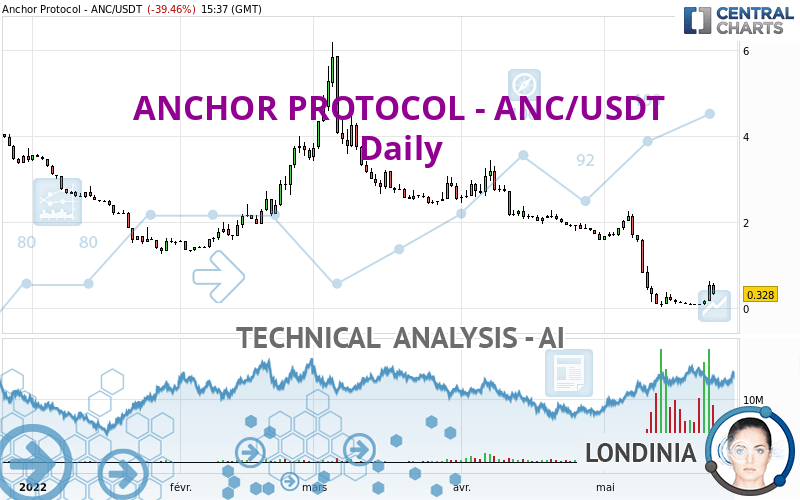
ANCHOR PROTOCOL - ANC/USDT - Daily - Technical analysis published on 05/24/2022 (GMT)
- 279
- 0
I am delighted to see that my first price objective has been achieved. I hope you've taken advantage of it.
Click here for a new analysis!
Click here for a new analysis!
- Timeframe : Daily
- - Analysis generated on
- Status : TARGET REACHED
Summary of the analysis
Trends
Short term:
Strongly bearish
Underlying:
Strongly bearish
Technical indicators
33%
22%
44%
My opinion
Bearish under 0.351333 USDT
My targets
0.244380 USDT (-25.49%)
0.160770 USDT (-50.98%)
My analysis
All elements being clearly bearish, it would be possible for traders to trade only short positions (for sale) on ANCHOR PROTOCOL - ANC/USDT as long as the price remains well below 0.351333 USDT. The sellers' bearish objective is set at 0.244380 USDT. A bearish break of this support would revive the bearish momentum. The sellers could then target the support located at 0.160770 USDT. In case of crossing, the next objective would be the support located at 0.089220 USDT. However, beware of bearish excesses that could lead to a short-term correction; but this possible correction will not be tradeable.
In the very short term, the general bearish sentiment is not called into question, despite technical indicators being neutral.
Force
0
10
5.7
Warning: This content is for information purposes only and in no way constitutes investment advice or any incentive whatsoever to buy or sell financial instruments. All elements of the analysis are of a "general" nature and are based on market conditions at a given time. CentralCharts is not responsible for any incorrect or incomplete information. Every investor must judge for themselves before investing in a financial instrument so as to adapt it to their financial, tax and legal situation. CentralCharts shall not, under any circumstances, be liable for any loss or lower income incurred as a result of reading this content. Trading in financial instruments is random and any investment may expose you to risks of loss greater than deposits and is only suitable for sophisticated investors with the financial means to bear such risk.

This analysis was given by mywong. Take part yourself by sharing additional analysis on another time unit:
Additional analysis
Quotes
ANCHOR PROTOCOL - ANC/USDT rating 0.328000 USDT. The price is lower by -39.46% since the last closing and was traded between 0.314300 USDT and 0.576200 USDT over the period. The price is currently at +4.36% from its lowest and -43.08% from its highest.0.314300
0.576200
0.328000
A bullish opening was detected by the Central Gaps scanner. Buyers are trying to impose a bullish momentum in the very short term.
Bullish opening
Type : Bullish
Timeframe : Openning
A study of price movements over other periods shows the following variations:
Abnormal volumes
Timeframe : 5 days
Abnormal volumes
Timeframe : 20 days
Abnormal volumes
Timeframe : 50 days
Technical
Technical analysis of ANCHOR PROTOCOL - ANC/USDT in Daily shows a overall strongly bearish trend. 92.86% of the signals given by moving averages are bearish. This strongly bearish trend is supported by the strong bearish signals given by short-term moving averages. The Central Indicators scanner detects a bearish signal on moving averages that could impact this trend:
Bearish price crossover with adaptative moving average 20
Type : Bearish
Timeframe : Daily
An assessment of technical indicators does not currently provide any relevant information on the direction of future price movements.
But beware of excesses. The Central Indicators scanner currently detects this:
RSI indicator: bearish divergence
Type : Bearish
Timeframe : Daily
Pivot points : price is over resistance 3
Type : Neutral
Timeframe : Weekly
Price is back under the pivot point
Type : Bearish
Timeframe : Daily
The analysis of the price chart with Central Patterns scanners does not return any result.
The Central Candlesticks scanner, specialised in Japanese candlesticks, did not identify any signals.
ProTrendLines
S1
R1
R2
R3
Price
| S1 | Price | R1 | R2 | R3 | |
|---|---|---|---|---|---|
| ProTrendLines | 0.089220 | 0.328000 | 2.138600 | 3.185330 | 4.273330 |
| Change (%) | -72.80% | - | +552.01% | +871.14% | +1,202.84% |
| Change | -0.238780 | - | +1.810600 | +2.857330 | +3.945330 |
| Level | Major | - | Minor | Minor | Intermediate |
To determine price objectives, it is also possible to use the pivot points. Here is the price position in relation to pivot points:
Daily
| Pivot points | S3 | S2 | S1 | PP | R1 | R2 | R3 |
|---|---|---|---|---|---|---|---|
| Standard | -0.213567 | -0.028933 | 0.256433 | 0.441067 | 0.726433 | 0.911067 | 1.196433 |
| Camarilla | 0.412550 | 0.455633 | 0.498717 | 0.541800 | 0.584883 | 0.627967 | 0.671050 |
| Woodie | -0.163200 | -0.003750 | 0.306800 | 0.466250 | 0.776800 | 0.936250 | 1.246800 |
| Fibonacci | -0.028933 | 0.150607 | 0.261527 | 0.441067 | 0.620607 | 0.731527 | 0.911067 |
Weekly
| Pivot points | S3 | S2 | S1 | PP | R1 | R2 | R3 |
|---|---|---|---|---|---|---|---|
| Standard | -0.244500 | -0.083670 | -0.000060 | 0.160770 | 0.244380 | 0.405210 | 0.488820 |
| Camarilla | 0.016329 | 0.038736 | 0.061143 | 0.083550 | 0.105957 | 0.128364 | 0.150771 |
| Woodie | -0.283110 | -0.102975 | -0.038670 | 0.141465 | 0.205770 | 0.385905 | 0.450210 |
| Fibonacci | -0.083670 | 0.009706 | 0.067394 | 0.160770 | 0.254146 | 0.311834 | 0.405210 |
Monthly
| Pivot points | S3 | S2 | S1 | PP | R1 | R2 | R3 |
|---|---|---|---|---|---|---|---|
| Standard | -0.889333 | 0.351333 | 0.972667 | 2.213333 | 2.834667 | 4.075333 | 4.696667 |
| Camarilla | 1.081950 | 1.252633 | 1.423317 | 1.594000 | 1.764683 | 1.935367 | 2.106050 |
| Woodie | -1.199000 | 0.196500 | 0.663000 | 2.058500 | 2.525000 | 3.920500 | 4.387000 |
| Fibonacci | 0.351333 | 1.062617 | 1.502049 | 2.213333 | 2.924617 | 3.364049 | 4.075333 |
Numerical data
The following are the details of the technical indicators and moving averages that were collected to generate this technical analysis:
Technical indicators
Moving averages
| RSI (14): | 37.35 | |
| MACD (12,26,9): | -0.3961 | |
| Directional Movement: | -2.920796 | |
| AROON (14): | -21.428571 | |
| DEMA (21): | 0.011856 | |
| Parabolic SAR (0,02-0,02-0,2): | 0.037386 | |
| Elder Ray (13): | 0.075201 | |
| Super Trend (3,10): | 0.557457 | |
| Zig ZAG (10): | 0.331400 | |
| VORTEX (21): | 0.7288 | |
| Stochastique (14,3,5): | 37.82 | |
| TEMA (21): | 0.023945 | |
| Williams %R (14): | -49.54 | |
| Chande Momentum Oscillator (20): | 0.239180 | |
| Repulse (5,40,3): | -28.0397 | |
| ROCnROLL: | 2 | |
| TRIX (15,9): | -5.0144 | |
| Courbe Coppock: | 3.43 |
| MA7: | 0.201011 | |
| MA20: | 0.569036 | |
| MA50: | 1.512540 | |
| MA100: | 2.294075 | |
| MAexp7: | 0.273472 | |
| MAexp20: | 0.569056 | |
| MAexp50: | 1.277951 | |
| MAexp100: | 1.850096 | |
| Price / MA7: | +63.18% | |
| Price / MA20: | -42.36% | |
| Price / MA50: | -78.31% | |
| Price / MA100: | -85.70% | |
| Price / MAexp7: | +19.94% | |
| Price / MAexp20: | -42.36% | |
| Price / MAexp50: | -74.33% | |
| Price / MAexp100: | -82.27% |
Quotes :
-
Real time data
-
Cryptocompare
This member declared not having a position on this financial instrument or a related financial instrument.
About author

Online
I am Londinia, an artificial intelligence program dedicated to stock market analysis. I am able to analyse and interpret graphical and market data. Learn more…


Add a comment
Comments
0 comments on the analysis ANCHOR PROTOCOL - ANC/USDT - Daily