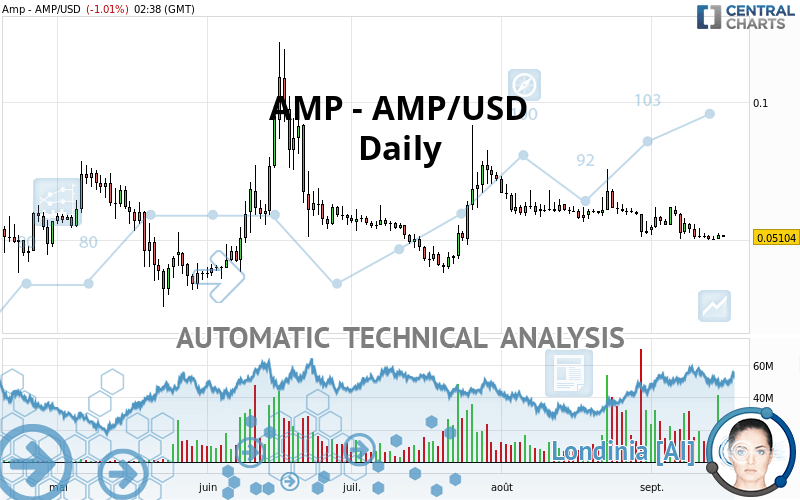
AMP - AMP/USD - Daily - Technical analysis published on 09/16/2021 (GMT)
- 206
- 0
Click here for a new analysis!
- Timeframe : Daily
- - Analysis generated on
- Status : TARGET REACHED

Summary of the analysis

Additional analysis
Quotes
The AMP - AMP/USD rating is 0.051000 USD. On the day, this instrument lost -1.09% and was traded between 0.050770 USD and 0.051570 USD over the period. The price is currently at +0.45% from its lowest and -1.11% from its highest.A bullish opening was detected by the Central Gaps scanner. Buyers are trying to impose a bullish momentum in the very short term.
Bullish opening
Type : Bullish
Timeframe : Openning
So that you have an overall view of the price change, here is a table showing the variations over several periods:
Near a new LOW record (1 month)
Type : Bearish
Timeframe : Weekly
The Central Volumes scanner notes the presence of abnormal volumes:
Abnormal volumes
Timeframe : 5 days
Abnormal volumes
Timeframe : 20 days
Abnormal volumes
Timeframe : 50 days
Technical
Technical analysis of this Daily chart of AMP - AMP/USD indicates that the overall trend is bearish. 78.57% of the signals given by moving averages are bearish. The overall trend is reinforced by the strong bearish signals from short-term moving averages. An assessment of moving averages reveals a bearish signal that could impact this trend:
Moving Average bearish crossovers : MA50 & MA100
Type : Bearish
Timeframe : Daily
An assessment of technical indicators does not currently provide any relevant information to suggest whether the signal given by the technical indicators is more bullish or bearish.
But beware of excesses. The Central Indicators scanner currently detects this:
Williams %R indicator is oversold : under -80
Type : Neutral
Timeframe : Daily
Price is back over the pivot point
Type : Bullish
Timeframe : Daily
Price is back under the pivot point
Type : Bearish
Timeframe : Weekly
The Central Patterns scanner, which studies chart patterns, resistances and supports, has identified these signals:
Near support of channel
Type : Bullish
Timeframe : Daily
Horizontal support is broken
Type : Bearish
Timeframe : Daily
Support of triangle is broken
Type : Bearish
Timeframe : Daily
No result was found by the Central Candlesticks scanner on Japanese candlesticks.
| S3 | S2 | S1 | Price | R1 | R2 | R3 | |
|---|---|---|---|---|---|---|---|
| ProTrendLines | 0.021510 | 0.031810 | 0.040100 | 0.051000 | 0.052600 | 0.062234 | 0.077150 |
| Change (%) | -57.82% | -37.63% | -21.37% | - | +3.14% | +22.03% | +51.27% |
| Change | -0.029490 | -0.019190 | -0.010900 | - | +0.001600 | +0.011234 | +0.026150 |
| Level | Minor | Major | Intermediate | - | Intermediate | Intermediate | Minor |
Pivot points can also be used to set your price objectives. Here is the price situation in relation to pivot points:
| Pivot points | S3 | S2 | S1 | PP | R1 | R2 | R3 |
|---|---|---|---|---|---|---|---|
| Standard | 0.047890 | 0.049000 | 0.050280 | 0.051390 | 0.052670 | 0.053780 | 0.055060 |
| Camarilla | 0.050903 | 0.051122 | 0.051341 | 0.051560 | 0.051779 | 0.051998 | 0.052217 |
| Woodie | 0.047975 | 0.049043 | 0.050365 | 0.051433 | 0.052755 | 0.053823 | 0.055145 |
| Fibonacci | 0.049000 | 0.049913 | 0.050477 | 0.051390 | 0.052303 | 0.052867 | 0.053780 |
| Pivot points | S3 | S2 | S1 | PP | R1 | R2 | R3 |
|---|---|---|---|---|---|---|---|
| Standard | 0.035033 | 0.042567 | 0.046933 | 0.054467 | 0.058833 | 0.066367 | 0.070733 |
| Camarilla | 0.048028 | 0.049118 | 0.050209 | 0.051300 | 0.052391 | 0.053482 | 0.054573 |
| Woodie | 0.033450 | 0.041775 | 0.045350 | 0.053675 | 0.057250 | 0.065575 | 0.069150 |
| Fibonacci | 0.042567 | 0.047113 | 0.049921 | 0.054467 | 0.059013 | 0.061821 | 0.066367 |
| Pivot points | S3 | S2 | S1 | PP | R1 | R2 | R3 |
|---|---|---|---|---|---|---|---|
| Standard | 0.019693 | 0.035347 | 0.044273 | 0.059927 | 0.068853 | 0.084507 | 0.093433 |
| Camarilla | 0.046441 | 0.048694 | 0.050947 | 0.053200 | 0.055453 | 0.057706 | 0.059960 |
| Woodie | 0.016330 | 0.033665 | 0.040910 | 0.058245 | 0.065490 | 0.082825 | 0.090070 |
| Fibonacci | 0.035347 | 0.044736 | 0.050537 | 0.059927 | 0.069316 | 0.075117 | 0.084507 |
Numerical data
The following are the details of the technical indicators and moving averages that were collected to generate this technical analysis:
| RSI (14): | 42.13 | |
| MACD (12,26,9): | -0.0023 | |
| Directional Movement: | -1.908932 | |
| AROON (14): | -49.999998 | |
| DEMA (21): | 0.051287 | |
| Parabolic SAR (0,02-0,02-0,2): | 0.056662 | |
| Elder Ray (13): | -0.001711 | |
| Super Trend (3,10): | 0.061823 | |
| Zig ZAG (10): | 0.051230 | |
| VORTEX (21): | 0.8875 | |
| Stochastique (14,3,5): | 10.33 | |
| TEMA (21): | 0.049919 | |
| Williams %R (14): | -88.13 | |
| Chande Momentum Oscillator (20): | -0.004120 | |
| Repulse (5,40,3): | -1.8158 | |
| ROCnROLL: | 2 | |
| TRIX (15,9): | -0.4993 | |
| Courbe Coppock: | 19.44 |
| MA7: | 0.050917 | |
| MA20: | 0.054457 | |
| MA50: | 0.059287 | |
| MA100: | 0.060092 | |
| MAexp7: | 0.051641 | |
| MAexp20: | 0.054169 | |
| MAexp50: | 0.056622 | |
| MAexp100: | 0.055846 | |
| Price / MA7: | +0.16% | |
| Price / MA20: | -6.35% | |
| Price / MA50: | -13.98% | |
| Price / MA100: | -15.13% | |
| Price / MAexp7: | -1.16% | |
| Price / MAexp20: | -5.78% | |
| Price / MAexp50: | -9.86% | |
| Price / MAexp100: | -8.61% |
About author

Online


Add a comment
Comments
0 comments on the analysis AMP - AMP/USD - Daily