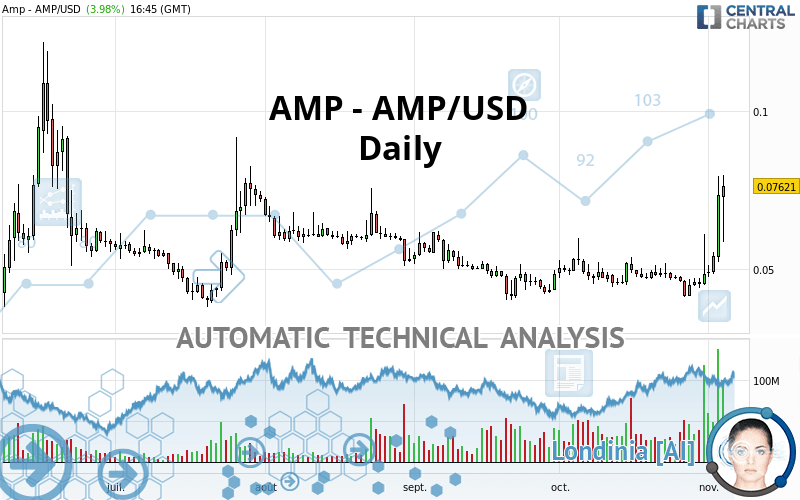
AMP - AMP/USD - Daily - Technical analysis published on 11/04/2021 (GMT)
- 203
- 0
Click here for a new analysis!
- Timeframe : Daily
- - Analysis generated on
- Status : INVALID

Summary of the analysis

Additional analysis
Quotes
AMP - AMP/USD rating 0.076510 USD. The price registered an increase of +4.39% on the session and was between 0.058500 USD and 0.079600 USD. This implies that the price is at +30.79% from its lowest and at -3.88% from its highest.The Central Gaps scanner detects a bearish opening marking the presence of sellers ahead of buyers at the opening but not sufficiently marked to allow the price to register a quotation gap.
Bearish opening
Type : Bearish
Timeframe : Openning
Here is a more detailed summary of the historical variations registered by AMP - AMP/USD:
Abnormal volumes
Timeframe : 5 days
Abnormal volumes
Timeframe : 20 days
Abnormal volumes
Timeframe : 50 days
Technical
Technical analysis of this Daily chart of AMP - AMP/USD indicates that the overall trend is strongly bullish. 82.14% of the signals given by moving averages are bullish. This strongly bullish trend is supported by the strong bullish signals given by short-term moving averages. The Central Indicators market scanner is currently detecting several bullish signals that could impact this trend:
Bullish trend reversal : Moving Average 100
Type : Bullish
Timeframe : Daily
Moving Average bullish crossovers : AMA20 & AMA50
Type : Bullish
Timeframe : Daily
Moving Average bullish crossovers : AMA50 & AMA100
Type : Bullish
Timeframe : Daily
Bullish price crossover with Moving Average 100
Type : Bullish
Timeframe : Daily
In fact, 16 technical indicators on 18 studied are currently positioned bullish. Caution: the Central Indicators scanner currently detects an excess:
RSI indicator is overbought : over 70
Type : Neutral
Timeframe : Daily
CCI indicator is overbought : over 100
Type : Neutral
Timeframe : Daily
Williams %R indicator is overbought : over -20
Type : Neutral
Timeframe : Daily
Pivot points : price is over resistance 3
Type : Neutral
Timeframe : Weekly
Ichimoku : price is over the cloud
Type : Bullish
Timeframe : Daily
SuperTrend indicator bullish reversal
Type : Bullish
Timeframe : Daily
Price is back over the pivot point
Type : Bullish
Timeframe : Daily
The Central Patterns scanner, which studies chart patterns, resistances and supports, has identified these signals:
Resistance of channel is broken
Type : Bullish
Timeframe : Daily
Resistance of triangle is broken
Type : Bullish
Timeframe : Daily
Central Candlesticks, the scanner specialised in Japanese candlesticks, detects these bullish signals that could support the hypothesis of a small rebound in the very short term:
Long white line
Type : Bullish
Timeframe : Daily
Three white soldiers
Type : Bullish
Timeframe : Daily
| S3 | S2 | S1 | Price | R1 | R2 | |
|---|---|---|---|---|---|---|
| ProTrendLines | 0.045435 | 0.053064 | 0.062134 | 0.076510 | 0.077150 | 0.108900 |
| Change (%) | -40.62% | -30.64% | -18.79% | - | +0.84% | +42.33% |
| Change | -0.031075 | -0.023446 | -0.014376 | - | +0.000640 | +0.032390 |
| Level | Major | Major | Intermediate | - | Minor | Intermediate |
Attention could also be paid to pivot points to set price objectives:
| Pivot points | S3 | S2 | S1 | PP | R1 | R2 | R3 |
|---|---|---|---|---|---|---|---|
| Standard | 0.029830 | 0.040990 | 0.057140 | 0.068300 | 0.084450 | 0.095610 | 0.111760 |
| Camarilla | 0.065780 | 0.068283 | 0.070787 | 0.073290 | 0.075793 | 0.078297 | 0.080800 |
| Woodie | 0.032325 | 0.042238 | 0.059635 | 0.069548 | 0.086945 | 0.096858 | 0.114255 |
| Fibonacci | 0.040990 | 0.051422 | 0.057868 | 0.068300 | 0.078732 | 0.085178 | 0.095610 |
| Pivot points | S3 | S2 | S1 | PP | R1 | R2 | R3 |
|---|---|---|---|---|---|---|---|
| Standard | 0.032977 | 0.037003 | 0.041067 | 0.045093 | 0.049157 | 0.053183 | 0.057247 |
| Camarilla | 0.042905 | 0.043647 | 0.044388 | 0.045130 | 0.045872 | 0.046613 | 0.047355 |
| Woodie | 0.032995 | 0.037013 | 0.041085 | 0.045103 | 0.049175 | 0.053193 | 0.057265 |
| Fibonacci | 0.037003 | 0.040094 | 0.042003 | 0.045093 | 0.048184 | 0.050093 | 0.053183 |
| Pivot points | S3 | S2 | S1 | PP | R1 | R2 | R3 |
|---|---|---|---|---|---|---|---|
| Standard | 0.019470 | 0.030250 | 0.039380 | 0.050160 | 0.059290 | 0.070070 | 0.079200 |
| Camarilla | 0.043035 | 0.044860 | 0.046685 | 0.048510 | 0.050335 | 0.052160 | 0.053985 |
| Woodie | 0.018645 | 0.029838 | 0.038555 | 0.049748 | 0.058465 | 0.069658 | 0.078375 |
| Fibonacci | 0.030250 | 0.037856 | 0.042554 | 0.050160 | 0.057766 | 0.062464 | 0.070070 |
Numerical data
The following are the details of the technical indicators and moving averages that were collected to generate this technical analysis:
| RSI (14): | 80.46 | |
| MACD (12,26,9): | 0.0039 | |
| Directional Movement: | 34.603121 | |
| AROON (14): | 57.142857 | |
| DEMA (21): | 0.056375 | |
| Parabolic SAR (0,02-0,02-0,2): | 0.043691 | |
| Elder Ray (13): | 0.014060 | |
| Super Trend (3,10): | 0.044249 | |
| Zig ZAG (10): | 0.074620 | |
| VORTEX (21): | 1.1005 | |
| Stochastique (14,3,5): | 78.44 | |
| TEMA (21): | 0.060453 | |
| Williams %R (14): | -11.12 | |
| Chande Momentum Oscillator (20): | 0.026780 | |
| Repulse (5,40,3): | 37.7271 | |
| ROCnROLL: | 1 | |
| TRIX (15,9): | 0.1982 | |
| Courbe Coppock: | 37.08 |
| MA7: | 0.055940 | |
| MA20: | 0.050483 | |
| MA50: | 0.048681 | |
| MA100: | 0.054217 | |
| MAexp7: | 0.060066 | |
| MAexp20: | 0.052772 | |
| MAexp50: | 0.051029 | |
| MAexp100: | 0.051800 | |
| Price / MA7: | +36.77% | |
| Price / MA20: | +51.56% | |
| Price / MA50: | +57.17% | |
| Price / MA100: | +41.12% | |
| Price / MAexp7: | +27.38% | |
| Price / MAexp20: | +44.98% | |
| Price / MAexp50: | +49.93% | |
| Price / MAexp100: | +47.70% |
About author

Online


Add a comment
Comments
0 comments on the analysis AMP - AMP/USD - Daily