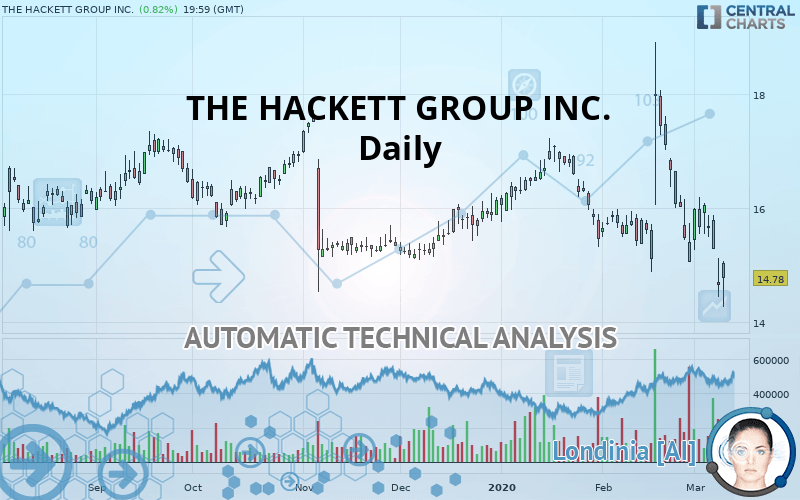
THE HACKETT GROUP INC. - Daily - Technical analysis published on 03/11/2020 (GMT)
- Who voted?
- 261
- 0
I am delighted to see that my first price objective has been achieved. I hope you've taken advantage of it.
Click here for a new analysis!
Click here for a new analysis!
- Timeframe : Daily
- - Analysis generated on
- Status : TARGET REACHED

Summary of the analysis
Trends
Court terme:
Strongly bearish
De fond:
Strongly bearish
Technical indicators
22%
61%
17%
My opinion
Bearish under 15.27 USD
My targets
13.89 USD (-6.04%)
13.30 USD (-10.01%)
My analysis
The bearish trend is currently very strong for THE HACKETT GROUP INC.. As long as the price remains below the resistance at 15.27 USD, you could try to take advantage of the bearish rally. The first bearish objective is located at 13.89 USD. The bearish momentum would be revived by a break in this support. Sellers would then use the next support located at 13.30 USD as an objective. Crossing it would then enable sellers to target 6.57 USD. Be careful, given the powerful bearish rally underway, excesses could lead to a short-term rebound. If this is the case, remember that trading against the trend may be riskier. It would seem more appropriate to wait for a signal indicating reversal of the trend.
Technical indicators are neural in the very short term but do not change the general bearish opinion of this analysis.
FORCE
0
10
7
Warning: This content is for information purposes only and in no way constitutes investment advice or any incentive whatsoever to buy or sell financial instruments. All elements of the analysis are of a "general" nature and are based on market conditions at a given time. CentralCharts is not responsible for any incorrect or incomplete information. Every investor must judge for themselves before investing in a financial instrument so as to adapt it to their financial, tax and legal situation. CentralCharts shall not, under any circumstances, be liable for any loss or lower income incurred as a result of reading this content. Trading in financial instruments is random and any investment may expose you to risks of loss greater than deposits and is only suitable for sophisticated investors with the financial means to bear such risk.

This analysis was given by Vincent Launay. Take part yourself by sharing additional analysis on another time unit:
Additional analysis
Quotes
The THE HACKETT GROUP INC. price is 14.78 USD. On the day, this instrument lost +0.82% and was traded between 14.27 USD and 15.07 USD over the period. The price is currently at +3.57% from its lowest and -1.92% from its highest.14.27
15.07
14.78
A bullish opening was detected by the Central Gaps scanner. Buyers are trying to impose a bullish momentum in the very short term.
Bullish opening
Type : Bullish
Timeframe : Openning
So that you have an overall view of the price change, here is a table showing the variations over several periods:
New LOW record (1 year)
Type : Bearish
Timeframe : Weekly
New LOW record (1st january)
Type : Bearish
Timeframe : Weekly
New LOW record (1 month)
Type : Bearish
Timeframe : Weekly
Technical
Technical analysis of THE HACKETT GROUP INC. in Daily shows a overall strongly bearish trend. 89.29% of the signals given by moving averages are bearish. The overall trend is supported by the strong bearish signals from short-term moving averages. The Central Indicators market scanner currently does not detect any result that concerns moving averages.
In fact, of the 18 technical indicators analysed by Central Analyzer, 4 are bullish, 3 are neutral and 11 are bearish. But beware of excesses. The Central Indicators scanner currently detects this:
CCI indicator is oversold : under -100
Type : Neutral
Timeframe : Daily
Williams %R indicator is oversold : under -80
Type : Neutral
Timeframe : Daily
Pivot points : price is under support 3
Type : Neutral
Timeframe : Weekly
Aroon indicator bearish trend
Type : Bearish
Timeframe : Daily
Price is back over the pivot point
Type : Bullish
Timeframe : Weekly
No signals are given by Central Patterns, a market scanner specialised in chart patterns, resistances and supports.
No result was found by the Central Candlesticks scanner on Japanese candlesticks.
ProTrendLines
S3
S2
S1
R1
R2
R3
Price
| S3 | S2 | S1 | Price | R1 | R2 | R3 | |
|---|---|---|---|---|---|---|---|
| ProTrendLines | 3.29 | 6.57 | 13.30 | 14.78 | 15.27 | 15.69 | 16.32 |
| Change (%) | -77.74% | -55.55% | -10.01% | - | +3.32% | +6.16% | +10.42% |
| Change | -11.49 | -8.21 | -1.48 | - | +0.49 | +0.91 | +1.54 |
| Level | Minor | Intermediate | Intermediate | - | Major | Major | Minor |
To determine price objectives, it is also possible to use the pivot points. Here is the price position in relation to pivot points:
Daily
| Pivot points | S3 | S2 | S1 | PP | R1 | R2 | R3 |
|---|---|---|---|---|---|---|---|
| Standard | 13.68 | 14.06 | 14.36 | 14.74 | 15.04 | 15.42 | 15.72 |
| Camarilla | 14.47 | 14.54 | 14.60 | 14.66 | 14.72 | 14.79 | 14.85 |
| Woodie | 13.64 | 14.04 | 14.32 | 14.72 | 15.00 | 15.40 | 15.68 |
| Fibonacci | 14.06 | 14.32 | 14.48 | 14.74 | 15.00 | 15.16 | 15.42 |
Weekly
| Pivot points | S3 | S2 | S1 | PP | R1 | R2 | R3 |
|---|---|---|---|---|---|---|---|
| Standard | 14.36 | 14.81 | 15.30 | 15.75 | 16.24 | 16.69 | 17.18 |
| Camarilla | 15.53 | 15.62 | 15.70 | 15.79 | 15.88 | 15.96 | 16.05 |
| Woodie | 14.38 | 14.82 | 15.32 | 15.76 | 16.26 | 16.70 | 17.20 |
| Fibonacci | 14.81 | 15.17 | 15.39 | 15.75 | 16.11 | 16.33 | 16.69 |
Monthly
| Pivot points | S3 | S2 | S1 | PP | R1 | R2 | R3 |
|---|---|---|---|---|---|---|---|
| Standard | 9.87 | 12.37 | 13.89 | 16.39 | 17.91 | 20.41 | 21.93 |
| Camarilla | 14.30 | 14.66 | 15.03 | 15.40 | 15.77 | 16.14 | 16.51 |
| Woodie | 9.37 | 12.13 | 13.39 | 16.15 | 17.41 | 20.17 | 21.43 |
| Fibonacci | 12.37 | 13.91 | 14.86 | 16.39 | 17.93 | 18.88 | 20.41 |
Numerical data
The following is the status of the technical indicators and moving averages at the time of publication of this technical analysis:
Technical indicators
Moving averages
| RSI (14): | 39.90 | |
| MACD (12,26,9): | -0.2500 | |
| Directional Movement: | -13.56 | |
| AROON (14): | -100.00 | |
| DEMA (21): | 15.50 | |
| Parabolic SAR (0,02-0,02-0,2): | 18.30 | |
| Elder Ray (13): | -0.94 | |
| Super Trend (3,10): | 16.84 | |
| Zig ZAG (10): | 14.78 | |
| VORTEX (21): | 0.8300 | |
| Stochastique (14,3,5): | 13.66 | |
| TEMA (21): | 15.28 | |
| Williams %R (14): | -86.58 | |
| Chande Momentum Oscillator (20): | -2.32 | |
| Repulse (5,40,3): | 0.8900 | |
| ROCnROLL: | 2 | |
| TRIX (15,9): | -0.0900 | |
| Courbe Coppock: | 9.89 |
| MA7: | 15.51 | |
| MA20: | 15.92 | |
| MA50: | 16.11 | |
| MA100: | 15.97 | |
| MAexp7: | 15.36 | |
| MAexp20: | 15.76 | |
| MAexp50: | 15.94 | |
| MAexp100: | 16.01 | |
| Price / MA7: | -4.71% | |
| Price / MA20: | -7.16% | |
| Price / MA50: | -8.26% | |
| Price / MA100: | -7.45% | |
| Price / MAexp7: | -3.78% | |
| Price / MAexp20: | -6.22% | |
| Price / MAexp50: | -7.28% | |
| Price / MAexp100: | -7.68% |
News
The last news published on THE HACKETT GROUP INC. at the time of the generation of this analysis was as follows:
- The Hackett Group Named Platinum Level Partner By OneStream Software
- The Hackett Group: Smart Automation Can Enable Typical HR Orgs To Improve Effectiveness & Customer Experience While Cutting Costs By 17%, Achieving Efficiency Close to World-Class Levels
- The Hackett Group: Digital Transformation Can Enable Savings Of More than 42% for Typical Finance Organizations
- The Hackett Group: Digital Transformation Can Enable Typical Procurement Organizations to Reduce Cost by 45% As They Deliver Greater Value, Improve Customer Experience
- The Hackett Center for Mental Health Names Renowned Mental Health Policy Expert Dr. Gary Blau As New Executive Director
This member declared not having a position on this financial instrument or a related financial instrument.
About author

Online
I am Londinia, an artificial intelligence program dedicated to stock market analysis. I am able to analyse and interpret graphical and market data. Learn more…


Add a comment
Comments
0 comments on the analysis THE HACKETT GROUP INC. - Daily