HALLMARK FINANCIAL SERVICES - Daily - Technical analysis published on 09/19/2019 (GMT)
- Who voted?
- 204
- 0
Click here for a new analysis!
- Timeframe : Daily
- - Analysis generated on
- Status : TARGET REACHED

Summary of the analysis
Additional analysis
Quotes
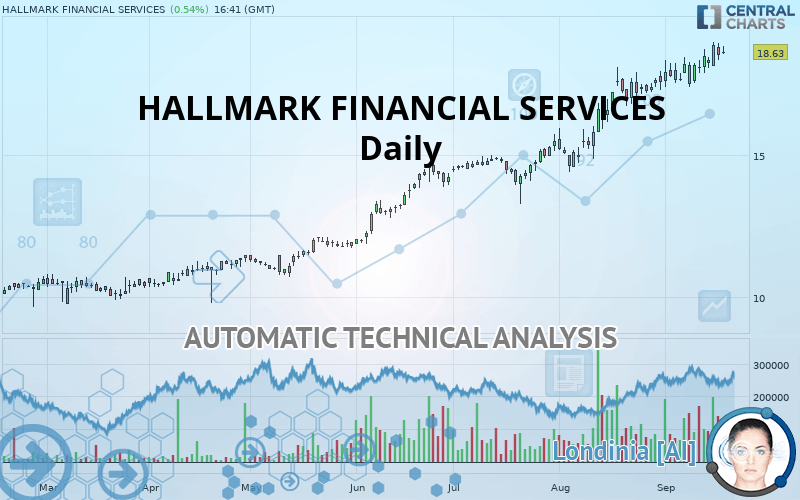
HALLMARK FINANCIAL SERVICES rating 18.63 USD. The price has increased by +0.54% since the last closing and was traded between 18.56 USD and 18.83 USD over the period. The price is currently at +0.38% from its lowest and -1.06% from its highest.The Central Gaps scanner detects a bullish opening. A small advantage for buyers in the very short term.
Bullish opening
Type : Bullish
Timeframe : Openning
So that you have an overall view of the price change, here is a table showing the variations over several periods:
New HIGH record (5 years)
Type : Bullish
Timeframe : Weekly
Near a new HIGH record (1 year)
Type : Bullish
Timeframe : Weekly
Near a new HIGH record (1st january)
Type : Bullish
Timeframe : Weekly
Near a new HIGH record (1 month)
Type : Bullish
Timeframe : Weekly
The Central Volumes scanner detects abnormal volumes on the asset:
Abnormal volumes
Timeframe : 5 days
Abnormal volumes
Timeframe : 20 days
Abnormal volumes
Timeframe : 50 days
Technical
A technical analysis in Daily of this HALLMARK FINANCIAL SERVICES chart shows a strongly bullish trend. 92.86% of the signals given by moving averages are bullish. The overall trend is supported by the strong bullish signals from short-term moving averages. The Central Indicators scanner does not detect any result on moving averages that would impact this trend.
In fact, 13 technical indicators on 18 studied are currently bullish. Caution: the Central Indicators scanner currently detects an excess:
CCI indicator is overbought : over 100
Type : Neutral
Timeframe : Daily
Previous candle closed over Bollinger bands
Type : Neutral
Timeframe : Daily
RSI indicator: bearish divergence
Type : Bearish
Timeframe : Daily
Williams %R indicator is overbought : over -20
Type : Neutral
Timeframe : Daily
Price is back over the pivot point
Type : Bullish
Timeframe : Weekly
Price is back under the pivot point
Type : Bearish
Timeframe : Daily
No signals are given by Central Patterns, a market scanner specialised in chart patterns, resistances and supports.
The presence of a bearish pattern in Japanese candlesticks detected by Central Candlesticks that could cause a correction in the very short term was also detected:
Bearish harami
Type : Bearish
Timeframe : Daily
| S3 | S2 | S1 | Price | |
|---|---|---|---|---|
| ProTrendLines | 11.88 | 14.60 | 17.17 | 18.63 |
| Change (%) | -36.23% | -21.63% | -7.84% | - |
| Change | -6.75 | -4.03 | -1.46 | - |
| Level | Major | Intermediate | Major | - |
Attention could also be paid to pivot points to set price objectives:
| Pivot points | S3 | S2 | S1 | PP | R1 | R2 | R3 |
|---|---|---|---|---|---|---|---|
| Standard | 17.66 | 18.00 | 18.26 | 18.60 | 18.87 | 19.21 | 19.47 |
| Camarilla | 18.36 | 18.42 | 18.48 | 18.53 | 18.59 | 18.64 | 18.70 |
| Woodie | 17.62 | 17.98 | 18.23 | 18.58 | 18.83 | 19.19 | 19.44 |
| Fibonacci | 18.00 | 18.23 | 18.37 | 18.60 | 18.83 | 18.98 | 19.21 |
| Pivot points | S3 | S2 | S1 | PP | R1 | R2 | R3 |
|---|---|---|---|---|---|---|---|
| Standard | 16.32 | 16.85 | 17.66 | 18.19 | 19.00 | 19.53 | 20.34 |
| Camarilla | 18.11 | 18.23 | 18.36 | 18.48 | 18.60 | 18.73 | 18.85 |
| Woodie | 16.47 | 16.92 | 17.81 | 18.26 | 19.15 | 19.60 | 20.49 |
| Fibonacci | 16.85 | 17.36 | 17.68 | 18.19 | 18.70 | 19.02 | 19.53 |
| Pivot points | S3 | S2 | S1 | PP | R1 | R2 | R3 |
|---|---|---|---|---|---|---|---|
| Standard | 11.57 | 12.98 | 15.28 | 16.69 | 18.99 | 20.40 | 22.70 |
| Camarilla | 16.56 | 16.90 | 17.24 | 17.58 | 17.92 | 18.26 | 18.60 |
| Woodie | 12.02 | 13.21 | 15.73 | 16.91 | 19.43 | 20.62 | 23.14 |
| Fibonacci | 12.98 | 14.40 | 15.27 | 16.69 | 18.11 | 18.98 | 20.40 |
Numerical data
The following is the status of the technical indicators and moving averages at the time of publication of this technical analysis:
| RSI (14): | 64.51 | |
| MACD (12,26,9): | 0.6300 | |
| Directional Movement: | 17.07 | |
| AROON (14): | 78.57 | |
| DEMA (21): | 18.70 | |
| Parabolic SAR (0,02-0,02-0,2): | 17.54 | |
| Elder Ray (13): | 0.54 | |
| Super Trend (3,10): | 16.89 | |
| Zig ZAG (10): | 18.64 | |
| VORTEX (21): | 1.0800 | |
| Stochastique (14,3,5): | 82.45 | |
| TEMA (21): | 18.72 | |
| Williams %R (14): | -23.81 | |
| Chande Momentum Oscillator (20): | 0.67 | |
| Repulse (5,40,3): | 0.7100 | |
| ROCnROLL: | 1 | |
| TRIX (15,9): | 0.5500 | |
| Courbe Coppock: | 10.75 |
| MA7: | 18.43 | |
| MA20: | 17.88 | |
| MA50: | 16.38 | |
| MA100: | 14.56 | |
| MAexp7: | 18.40 | |
| MAexp20: | 17.84 | |
| MAexp50: | 16.59 | |
| MAexp100: | 15.09 | |
| Price / MA7: | +1.09% | |
| Price / MA20: | +4.19% | |
| Price / MA50: | +13.74% | |
| Price / MA100: | +27.95% | |
| Price / MAexp7: | +1.25% | |
| Price / MAexp20: | +4.43% | |
| Price / MAexp50: | +12.30% | |
| Price / MAexp100: | +23.46% |
News
The last news published on HALLMARK FINANCIAL SERVICES at the time of the generation of this analysis was as follows:
- AM Best Affirms Credit Ratings of Hallmark Financial Services, Inc. and Its Subsidiaries
-
 Hallmark Financial Svcs
-
Hallmark Financial Svcs
- Robert Collins Appointed Head of Standard Commercial Business Unit for Hallmark Financial Services Inc.
- Hallmark Financial Services, Inc. Announces Third Quarter 2016 Earnings Results
About author

Online


Add a comment
Comments
0 comments on the analysis HALLMARK FINANCIAL SERVICES - Daily