HALMA ORD 10P - Daily - Technical analysis published on 08/12/2019 (GMT)
- Who voted?
- 251
- 0
Click here for a new analysis!
- Timeframe : Daily
- - Analysis generated on
- Status : TARGET REACHED

Summary of the analysis

Additional analysis
Quotes
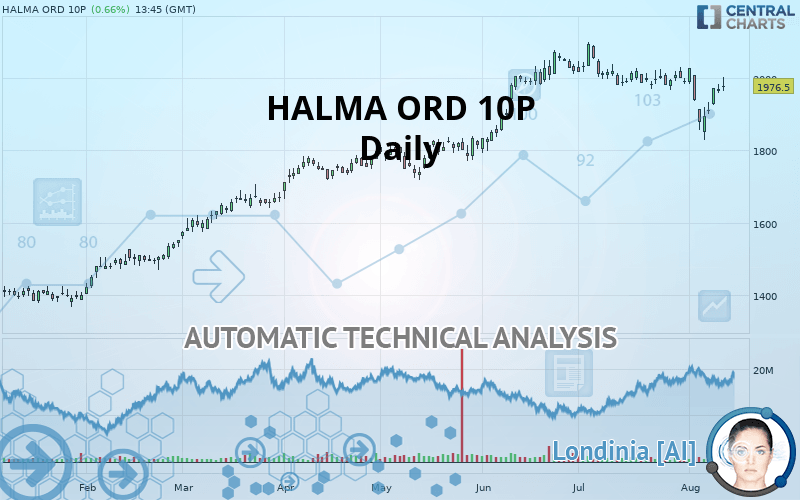
HALMA ORD 10P rating 1,976.5 GBX. The price has increased by +0.66% since the last closing and was traded between 1,964.0 GBX and 2,003.0 GBX over the period. The price is currently at +0.64% from its lowest and -1.32% from its highest.The Central Gaps scanner detects a bullish opening marking the presence of buyers ahead of sellers at the opening but not sufficiently marked to allow the price to register a quotation gap.
Bullish opening
Type : Bullish
Timeframe : Openning
A study of price movements over other periods shows the following variations:
Near a new HIGH record (5 years)
Type : Bullish
Timeframe : Weekly
Near a new HIGH record (1 year)
Type : Bullish
Timeframe : Weekly
Near a new HIGH record (1st january)
Type : Bullish
Timeframe : Weekly
Near a new HIGH record (1 month)
Type : Bullish
Timeframe : Weekly
Technical
Technical analysis of HALMA ORD 10P in Daily shows an overall bullish trend. The signals given by moving averages are 75% bullish. This bullish trend could slow down given the neutral signals currently being given by short-term moving averages. The Central Indicators scanner detects a bearish signal on moving averages that could impact this trend:
Moving Average bearish crossovers : MA20 & MA50
Type : Bearish
Timeframe : Daily
In fact, 11 technical indicators on 18 studied are currently bullish. Central Indicators, the detector scanner for these technical indicators has recently detected several signals:
RSI indicator is back under 50
Type : Bearish
Timeframe : Daily
Price is back over the pivot point
Type : Bullish
Timeframe : Weekly
Central Patterns, the market scanner focusing on chart patterns, resistances and supports found these results:
Near horizontal resistance
Type : Bearish
Timeframe : Daily
Near resistance of channel
Type : Bearish
Timeframe : Daily
Near resistance of triangle
Type : Bearish
Timeframe : Daily
Central Candlesticks, the scanner specialised in Japanese candlesticks, detects a bearish signal that could support the hypothesis of a small drop in the very short term:
Bearish harami
Type : Bearish
Timeframe : Daily
| S3 | S2 | S1 | Price | R1 | R2 | |
|---|---|---|---|---|---|---|
| ProTrendLines | 1,655.0 | 1,736.5 | 1,878.5 | 1,976.5 | 2,016.8 | 2,094.0 |
| Change (%) | -16.27% | -12.14% | -4.96% | - | +2.04% | +5.94% |
| Change | -321.5 | -240.0 | -98.0 | - | +40.3 | +117.5 |
| Level | Minor | Minor | Intermediate | - | Intermediate | Major |
Pivot points can also be used to set your price objectives. Here is the price situation in relation to pivot points:
| Pivot points | S3 | S2 | S1 | PP | R1 | R2 | R3 |
|---|---|---|---|---|---|---|---|
| Standard | 1,925.5 | 1,941.5 | 1,952.5 | 1,968.5 | 1,979.5 | 1,995.5 | 2,006.5 |
| Camarilla | 1,956.1 | 1,958.6 | 1,961.0 | 1,963.5 | 1,966.0 | 1,968.5 | 1,970.9 |
| Woodie | 1,923.0 | 1,940.3 | 1,950.0 | 1,967.3 | 1,977.0 | 1,994.3 | 2,004.0 |
| Fibonacci | 1,941.5 | 1,951.8 | 1,958.2 | 1,968.5 | 1,978.8 | 1,985.2 | 1,995.5 |
| Pivot points | S3 | S2 | S1 | PP | R1 | R2 | R3 |
|---|---|---|---|---|---|---|---|
| Standard | 1,709.7 | 1,768.8 | 1,866.2 | 1,925.3 | 2,022.7 | 2,081.8 | 2,179.2 |
| Camarilla | 1,920.5 | 1,934.8 | 1,949.2 | 1,963.5 | 1,977.9 | 1,992.2 | 2,006.5 |
| Woodie | 1,728.8 | 1,778.4 | 1,885.3 | 1,934.9 | 2,041.8 | 2,091.4 | 2,198.3 |
| Fibonacci | 1,768.8 | 1,828.6 | 1,865.6 | 1,925.3 | 1,985.1 | 2,022.1 | 2,081.8 |
| Pivot points | S3 | S2 | S1 | PP | R1 | R2 | R3 |
|---|---|---|---|---|---|---|---|
| Standard | 1,819.6 | 1,893.3 | 1,941.7 | 2,015.3 | 2,063.7 | 2,137.4 | 2,185.7 |
| Camarilla | 1,956.4 | 1,967.6 | 1,978.8 | 1,990.0 | 2,001.2 | 2,012.4 | 2,023.6 |
| Woodie | 1,807.0 | 1,887.0 | 1,929.0 | 2,009.0 | 2,051.0 | 2,131.0 | 2,173.0 |
| Fibonacci | 1,893.3 | 1,939.9 | 1,968.7 | 2,015.3 | 2,062.0 | 2,090.8 | 2,137.4 |
Numerical data
The following are the details of the technical indicators and moving averages that were collected to generate this technical analysis:
| RSI (14): | 51.70 | |
| MACD (12,26,9): | -8.5000 | |
| Directional Movement: | -0.4 | |
| AROON (14): | -35.7 | |
| DEMA (21): | 1,960.9 | |
| Parabolic SAR (0,02-0,02-0,2): | 1,828.0 | |
| Elder Ray (13): | 20.8 | |
| Super Trend (3,10): | 2,010.1 | |
| Zig ZAG (10): | 1,980.0 | |
| VORTEX (21): | 0.9000 | |
| Stochastique (14,3,5): | 70.60 | |
| TEMA (21): | 1,938.3 | |
| Williams %R (14): | -26.10 | |
| Chande Momentum Oscillator (20): | -3.5 | |
| Repulse (5,40,3): | 0.6000 | |
| ROCnROLL: | 1 | |
| TRIX (15,9): | 0.0000 | |
| Courbe Coppock: | 4.60 |
| MA7: | 1,934.0 | |
| MA20: | 1,976.7 | |
| MA50: | 1,981.1 | |
| MA100: | 1,865.3 | |
| MAexp7: | 1,956.8 | |
| MAexp20: | 1,969.1 | |
| MAexp50: | 1,947.5 | |
| MAexp100: | 1,858.8 | |
| Price / MA7: | +2.20% | |
| Price / MA20: | -0.01% | |
| Price / MA50: | -0.23% | |
| Price / MA100: | +5.96% | |
| Price / MAexp7: | +1.01% | |
| Price / MAexp20: | +0.38% | |
| Price / MAexp50: | +1.49% | |
| Price / MAexp100: | +6.33% |
 Halma
HalmaAbout author

Online


Add a comment
Comments
0 comments on the analysis HALMA ORD 10P - Daily