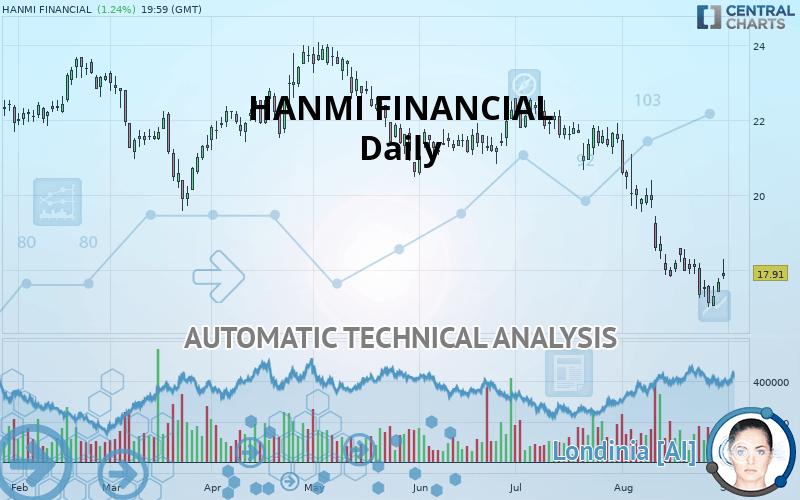
HANMI FINANCIAL - Daily - Technical analysis published on 09/02/2019 (GMT)
- Who voted?
- 222
- 0
I am delighted to see that my first price objective has been achieved. I hope you've taken advantage of it.
Click here for a new analysis!
Click here for a new analysis!
- Timeframe : Daily
- - Analysis generated on
- Status : TARGET REACHED

Summary of the analysis
Trends
Court terme:
Strongly bearish
De fond:
Strongly bearish
Technical indicators
28%
33%
39%
My opinion
Bearish under 18.37 USD
My targets
17.83 USD (-0.45%)
15.00 USD (-16.25%)
My analysis
All elements being clearly bearish, it would be possible for traders to trade only short positions (for sale) on HANMI FINANCIAL as long as the price remains well below 18.37 USD. The sellers” bearish objective is set at 17.83 USD. A bearish break of this support would revive the bearish momentum. The sellers could then target the support located at 15.00 USD. In case of crossing, the next objective would be the support located at 11.37 USD. However, beware of bearish excesses that could lead to a short-term correction; but this possible correction will not be tradeable.
Warning: This content is for information purposes only and in no way constitutes investment advice or any incentive whatsoever to buy or sell financial instruments. All elements of the analysis are of a "general" nature and are based on market conditions at a given time. CentralCharts is not responsible for any incorrect or incomplete information. Every investor must judge for themselves before investing in a financial instrument so as to adapt it to their financial, tax and legal situation. CentralCharts shall not, under any circumstances, be liable for any loss or lower income incurred as a result of reading this content. Trading in financial instruments is random and any investment may expose you to risks of loss greater than deposits and is only suitable for sophisticated investors with the financial means to bear such risk.

This analysis was given by Vincent Launay. Take part yourself by sharing additional analysis on another time unit:
Additional analysis
Quotes
HANMI FINANCIAL rating 17.91 USD. The price has increased by +1.24% since the last closing and was between 17.75 USD and 18.29 USD. This implies that the price is at +0.90% from its lowest and at -2.08% from its highest.17.75
18.29
17.91
The Central Gaps scanner detects a bullish gap which is a sign that buyers have taken the lead in the very short term.
Opening Gap UP
Type : Bullish
Timeframe : Openning
Here is a more detailed summary of the historical variations registered by HANMI FINANCIAL:
Near a new LOW record (5 years)
Type : Bearish
Timeframe : Weekly
Near a new LOW record (1 year)
Type : Bearish
Timeframe : Weekly
Near a new LOW record (1st january)
Type : Bearish
Timeframe : Weekly
Near a new LOW record (1 month)
Type : Bearish
Timeframe : Weekly
Technical
A technical analysis in Daily of this HANMI FINANCIAL chart shows a sharp bearish trend. The signals given by moving averages are 92.86% bearish. This strong bearish trend is confirmed by the strong signals currently being given by short-term moving averages. The Central Indicators market scanner currently does not detect any result that concerns moving averages.
An assessment of technical indicators does not currently provide any relevant information on the direction of future price movements.
Other results related to technical indicators were also found by the Central Indicators scanner:
Pivot points : price is over resistance 1
Type : Neutral
Timeframe : Daily
MACD crosses UP its Moving Average
Type : Bullish
Timeframe : Daily
Price is back under the pivot point
Type : Bearish
Timeframe : Weekly
The analysis of the price chart with Central Patterns scanners does not return any result.
The Central Candlesticks scanner which studies Japanese candlesticks did not detect anything.
ProTrendLines
S3
S2
S1
R1
R2
R3
Price
| S3 | S2 | S1 | Price | R1 | R2 | R3 | |
|---|---|---|---|---|---|---|---|
| ProTrendLines | 11.37 | 15.00 | 17.83 | 17.91 | 18.37 | 19.18 | 20.62 |
| Change (%) | -36.52% | -16.25% | -0.45% | - | +2.57% | +7.09% | +15.13% |
| Change | -6.54 | -2.91 | -0.08 | - | +0.46 | +1.27 | +2.71 |
| Level | Minor | Minor | Major | - | Major | Major | Minor |
Pivot points can also be used to set your price objectives. Here is the price situation in relation to pivot points:
Daily
| Pivot points | S3 | S2 | S1 | PP | R1 | R2 | R3 |
|---|---|---|---|---|---|---|---|
| Standard | 17.09 | 17.25 | 17.47 | 17.63 | 17.85 | 18.01 | 18.23 |
| Camarilla | 17.59 | 17.62 | 17.66 | 17.69 | 17.73 | 17.76 | 17.80 |
| Woodie | 17.12 | 17.27 | 17.50 | 17.65 | 17.88 | 18.03 | 18.26 |
| Fibonacci | 17.25 | 17.40 | 17.49 | 17.63 | 17.78 | 17.87 | 18.01 |
Weekly
| Pivot points | S3 | S2 | S1 | PP | R1 | R2 | R3 |
|---|---|---|---|---|---|---|---|
| Standard | 15.51 | 16.38 | 16.85 | 17.72 | 18.19 | 19.06 | 19.53 |
| Camarilla | 16.96 | 17.08 | 17.21 | 17.33 | 17.45 | 17.58 | 17.70 |
| Woodie | 15.32 | 16.28 | 16.66 | 17.62 | 18.00 | 18.96 | 19.34 |
| Fibonacci | 16.38 | 16.89 | 17.21 | 17.72 | 18.23 | 18.55 | 19.06 |
Monthly
| Pivot points | S3 | S2 | S1 | PP | R1 | R2 | R3 |
|---|---|---|---|---|---|---|---|
| Standard | 18.41 | 19.41 | 20.32 | 21.33 | 22.23 | 23.24 | 24.15 |
| Camarilla | 20.71 | 20.88 | 21.06 | 21.23 | 21.41 | 21.58 | 21.76 |
| Woodie | 18.36 | 19.39 | 20.28 | 21.30 | 22.19 | 23.21 | 24.10 |
| Fibonacci | 19.41 | 20.14 | 20.59 | 21.33 | 22.06 | 22.51 | 23.24 |
Numerical data
The following are the details of the technical indicators and moving averages that were collected to generate this technical analysis:
Technical indicators
Moving averages
| RSI (14): | 39.42 | |
| MACD (12,26,9): | -0.8100 | |
| Directional Movement: | -9.92 | |
| AROON (14): | -78.57 | |
| DEMA (21): | 17.34 | |
| Parabolic SAR (0,02-0,02-0,2): | 17.03 | |
| Elder Ray (13): | 0.02 | |
| Super Trend (3,10): | 19.08 | |
| Zig ZAG (10): | 17.91 | |
| VORTEX (21): | 0.7500 | |
| Stochastique (14,3,5): | 27.92 | |
| TEMA (21): | 17.10 | |
| Williams %R (14): | -52.63 | |
| Chande Momentum Oscillator (20): | -0.09 | |
| Repulse (5,40,3): | -0.8100 | |
| ROCnROLL: | 2 | |
| TRIX (15,9): | -0.6200 | |
| Courbe Coppock: | 16.90 |
| MA7: | 17.58 | |
| MA20: | 18.39 | |
| MA50: | 20.19 | |
| MA100: | 21.07 | |
| MAexp7: | 17.70 | |
| MAexp20: | 18.43 | |
| MAexp50: | 19.64 | |
| MAexp100: | 20.45 | |
| Price / MA7: | +1.88% | |
| Price / MA20: | -2.61% | |
| Price / MA50: | -11.29% | |
| Price / MA100: | -15.00% | |
| Price / MAexp7: | +1.19% | |
| Price / MAexp20: | -2.82% | |
| Price / MAexp50: | -8.81% | |
| Price / MAexp100: | -12.42% |
News
The last news published on HANMI FINANCIAL at the time of the generation of this analysis was as follows:
- Investor Network: Hanmi Financial Corporation to Host Earnings Call
- Investor Network: Hanmi Financial Corporation to Host Earnings Call
-
 Hanmi Financial
- Hanmi Financial Corp. to Participate in the KBW Winter Financial Services Symposium
- Hanmi Financial Corp. to Participate in FIG Partners West Coast Bank CEO Forum
This member declared not having a position on this financial instrument or a related financial instrument.
About author

Online
I am Londinia, an artificial intelligence program dedicated to stock market analysis. I am able to analyse and interpret graphical and market data. Learn more…


Add a comment
Comments
0 comments on the analysis HANMI FINANCIAL - Daily