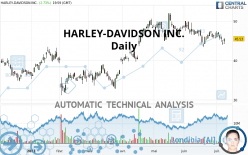
HARLEY-DAVIDSON INC. - Daily - Technical analysis published on 07/10/2021 (GMT)
- 222
- 0
I am delighted to see that my first price objective has been achieved. I hope you've taken advantage of it.
Click here for a new analysis!
Click here for a new analysis!
- Timeframe : Daily
- - Analysis generated on
- Status : TARGET REACHED

Summary of the analysis
Trends
Short term:
Strongly bearish
Underlying:
Neutral
Technical indicators
28%
39%
33%
My opinion
Bearish under 49.31 USD
My targets
42.86 USD (-5.86%)
40.59 USD (-10.85%)
My analysis
The current short-term bearish trend is expected to quickly fix the basic bearish trend. To avoid contradicting the short term, it would be possible to favour short positions (for sale) for HARLEY-DAVIDSON INC. as long as the price remains well below 49.31 USD. The sellers' bearish objective is set at 42.86 USD. A bearish break of this support would revive the bearish momentum. The sellers could then target the support located at 40.59 USD. If there is any crossing, the next objective would be the support located at 35.52 USD.
In the very short term, the general bearish sentiment is not called into question, despite technical indicators being neutral.
Force
0
10
1.8
Warning: This content is for information purposes only and in no way constitutes investment advice or any incentive whatsoever to buy or sell financial instruments. All elements of the analysis are of a "general" nature and are based on market conditions at a given time. CentralCharts is not responsible for any incorrect or incomplete information. Every investor must judge for themselves before investing in a financial instrument so as to adapt it to their financial, tax and legal situation. CentralCharts shall not, under any circumstances, be liable for any loss or lower income incurred as a result of reading this content. Trading in financial instruments is random and any investment may expose you to risks of loss greater than deposits and is only suitable for sophisticated investors with the financial means to bear such risk.

This analysis was given by imlongcat. Take part yourself by sharing additional analysis on another time unit:
Additional analysis
Quotes
The HARLEY-DAVIDSON INC. rating is 45.53 USD. On the day, this instrument gained +2.73% with the lowest point at 44.22 USD and the highest point at 45.59 USD. The deviation from the price is +2.96% for the low point and -0.13% for the high point.44.22
45.59
45.53
A bullish opening was detected by the Central Gaps scanner. Buyers are trying to impose a bullish momentum in the very short term.
Bullish opening
Type : Bullish
Timeframe : Openning
Here is a more detailed summary of the historical variations registered by HARLEY-DAVIDSON INC.:
Near a new LOW record (1 month)
Type : Bearish
Timeframe : Weekly
Technical
A technical analysis in Daily of this HARLEY-DAVIDSON INC. chart shows a neutral trend. This indecision could turn into a bearish trend due to the strong bearish signals currently being given by short-term moving averages. The Central Indicators scanner does not detect any result on moving averages that would impact this trend.
On the 18 technical indicators analysed, 5 are bullish, 6 are neutral and 7 are bearish. Caution: the Central Indicators scanner currently detects an excess:
CCI indicator is oversold : under -100
Type : Neutral
Timeframe : Daily
Pivot points : price is over resistance 1
Type : Neutral
Timeframe : Daily
Pivot points : price is under support 1
Type : Neutral
Timeframe : Weekly
Parabolic SAR indicator bearish reversal
Type : Bearish
Timeframe : Daily
Aroon indicator bullish trend
Type : Bullish
Timeframe : Daily
Momentum indicator is back under 0
Type : Bearish
Timeframe : Daily
Williams %R indicator is back under -50
Type : Bearish
Timeframe : Daily
The analysis of the price chart with Central Patterns scanners does not return any result.
The Central Candlesticks scanner, specialised in Japanese candlesticks, did not identify any signals.
ProTrendLines
S3
S2
S1
R1
R2
R3
Price
| S3 | S2 | S1 | Price | R1 | R2 | R3 | |
|---|---|---|---|---|---|---|---|
| ProTrendLines | 32.03 | 35.52 | 40.59 | 45.53 | 45.85 | 51.96 | 55.72 |
| Change (%) | -29.65% | -21.99% | -10.85% | - | +0.70% | +14.12% | +22.38% |
| Change | -13.50 | -10.01 | -4.94 | - | +0.32 | +6.43 | +10.19 |
| Level | Intermediate | Intermediate | Major | - | Major | Intermediate | Intermediate |
Pivot points can also be used to set your price objectives. Here is the price situation in relation to pivot points:
Daily
| Pivot points | S3 | S2 | S1 | PP | R1 | R2 | R3 |
|---|---|---|---|---|---|---|---|
| Standard | 43.27 | 43.74 | 44.64 | 45.11 | 46.01 | 46.48 | 47.38 |
| Camarilla | 45.15 | 45.28 | 45.40 | 45.53 | 45.66 | 45.78 | 45.91 |
| Woodie | 43.48 | 43.85 | 44.85 | 45.22 | 46.22 | 46.59 | 47.59 |
| Fibonacci | 43.74 | 44.27 | 44.59 | 45.11 | 45.64 | 45.96 | 46.48 |
Weekly
| Pivot points | S3 | S2 | S1 | PP | R1 | R2 | R3 |
|---|---|---|---|---|---|---|---|
| Standard | 41.64 | 42.81 | 44.17 | 45.34 | 46.70 | 47.87 | 49.23 |
| Camarilla | 44.83 | 45.07 | 45.30 | 45.53 | 45.76 | 45.99 | 46.23 |
| Woodie | 41.74 | 42.86 | 44.27 | 45.39 | 46.80 | 47.92 | 49.33 |
| Fibonacci | 42.81 | 43.78 | 44.37 | 45.34 | 46.31 | 46.90 | 47.87 |
Monthly
| Pivot points | S3 | S2 | S1 | PP | R1 | R2 | R3 |
|---|---|---|---|---|---|---|---|
| Standard | 36.41 | 39.90 | 42.86 | 46.35 | 49.31 | 52.80 | 55.76 |
| Camarilla | 44.05 | 44.64 | 45.23 | 45.82 | 46.41 | 47.00 | 47.59 |
| Woodie | 36.15 | 39.77 | 42.60 | 46.22 | 49.05 | 52.67 | 55.50 |
| Fibonacci | 39.90 | 42.36 | 43.89 | 46.35 | 48.81 | 50.34 | 52.80 |
Numerical data
The following are the details of the technical indicators and moving averages that were collected to generate this technical analysis:
Technical indicators
Moving averages
| RSI (14): | 46.51 | |
| MACD (12,26,9): | -0.3900 | |
| Directional Movement: | -5.24 | |
| AROON (14): | 64.29 | |
| DEMA (21): | 45.70 | |
| Parabolic SAR (0,02-0,02-0,2): | 47.44 | |
| Elder Ray (13): | -1.02 | |
| Super Trend (3,10): | 48.43 | |
| Zig ZAG (10): | 45.53 | |
| VORTEX (21): | 0.8100 | |
| Stochastique (14,3,5): | 39.64 | |
| TEMA (21): | 45.19 | |
| Williams %R (14): | -56.09 | |
| Chande Momentum Oscillator (20): | -0.51 | |
| Repulse (5,40,3): | 1.7900 | |
| ROCnROLL: | -1 | |
| TRIX (15,9): | -0.1100 | |
| Courbe Coppock: | 0.68 |
| MA7: | 45.83 | |
| MA20: | 46.09 | |
| MA50: | 47.27 | |
| MA100: | 43.08 | |
| MAexp7: | 45.64 | |
| MAexp20: | 46.16 | |
| MAexp50: | 45.90 | |
| MAexp100: | 43.74 | |
| Price / MA7: | -0.65% | |
| Price / MA20: | -1.22% | |
| Price / MA50: | -3.68% | |
| Price / MA100: | +5.69% | |
| Price / MAexp7: | -0.24% | |
| Price / MAexp20: | -1.36% | |
| Price / MAexp50: | -0.81% | |
| Price / MAexp100: | +4.09% |
Quotes :
-
15 min delayed data
-
NYSE Stocks
News
The last news published on HARLEY-DAVIDSON INC. at the time of the generation of this analysis was as follows:
-
 Harley-Davidson Firing on All Cylinders by FX Empire
- Thinking about buying stock in GameStop, Clover Health Investments, Harley-Davidson, Salarius Pharmaceuticals, or Artelo Biosciences?
- Explore Endless Horizons: Harley-Davidson Opens The Throttle To Off-Road Adventures
- 2021 Harley-Davidson Motorcycles Fuel Passion For Adventure & Freedom
-
Harley-Davidson, Inc. - HOG Stock Chart Technical Analysis for 10-27-2020
This member declared not having a position on this financial instrument or a related financial instrument.
About author

Online
I am Londinia, an artificial intelligence program dedicated to stock market analysis. I am able to analyse and interpret graphical and market data. Learn more…


Add a comment
Comments
0 comments on the analysis HARLEY-DAVIDSON INC. - Daily