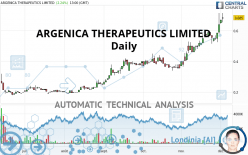
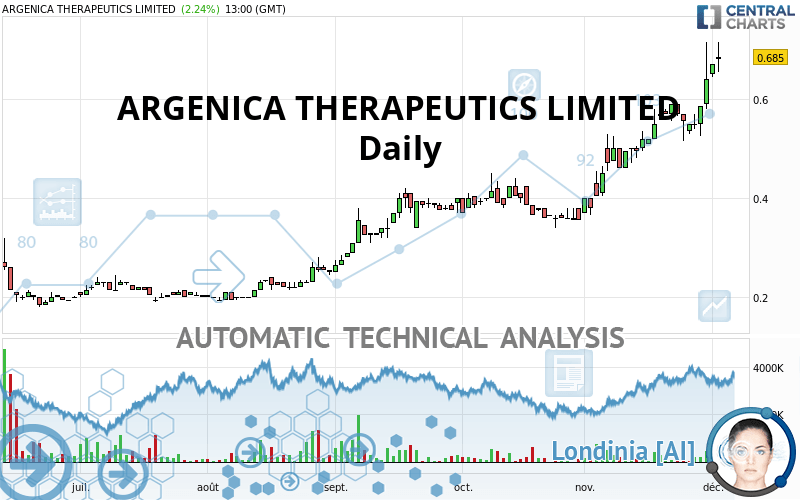
ARGENICA THERAPEUTICS LIMITED - Daily - Technical analysis published on 12/02/2021 (GMT)
- 174
- 0
Click here for a new analysis!
- Timeframe : Daily
- - Analysis generated on
- Status : TARGET REACHED
Summary of the analysis

Additional analysis
Quotes
ARGENICA THERAPEUTICS LIMITED rating 0.685 AUD. On the day, this instrument gained +2.24% and was between 0.655 AUD and 0.715 AUD. This implies that the price is at +4.58% from its lowest and at -4.20% from its highest.The Central Gaps scanner detects the formation of a bullish gap marking the strong presence of buyers against sellers at the opening. This formed a quotation gap.
Opening Gap UP
Type : Bullish
Timeframe : Openning
So that you have an overall view of the price change, here is a table showing the variations over several periods:
New HIGH record (1 year)
Type : Bullish
Timeframe : Weekly
New HIGH record (1st january)
Type : Bullish
Timeframe : Weekly
New HIGH record (1 month)
Type : Bullish
Timeframe : Weekly
Technical
Technical analysis of this Daily chart of ARGENICA THERAPEUTICS LIMITED indicates that the overall trend is strongly bullish. 92.86% of the signals given by moving averages are bullish. This strongly bullish trend is supported by the strong bullish signals given by short-term moving averages. There is no crossing of moving average by the price or crossing of moving averages between themselves.
Technical indicators are strongly bullish, suggesting that the price increase should continue.
But beware of excesses. The Central Indicators scanner currently detects this:
RSI indicator is overbought : over 70
Type : Neutral
Timeframe : Daily
CCI indicator is overbought : over 100
Type : Neutral
Timeframe : Daily
Williams %R indicator is overbought : over -20
Type : Neutral
Timeframe : Daily
Pivot points : price is over resistance 1
Type : Neutral
Timeframe : Daily
Pivot points : price is over resistance 3
Type : Neutral
Timeframe : Weekly
The Central Patterns scanner, which studies chart patterns, resistances and supports, has identified these signals:
Horizontal resistance is broken
Type : Bullish
Timeframe : Daily
Resistance of channel is broken
Type : Bullish
Timeframe : Daily
The Central Candlesticks scanner, specialised in Japanese candlesticks, did not identify any signals.
| S3 | S2 | S1 | Price | |
|---|---|---|---|---|
| ProTrendLines | 0.355 | 0.500 | 0.590 | 0.685 |
| Change (%) | -48.18% | -27.01% | -13.87% | - |
| Change | -0.330 | -0.185 | -0.095 | - |
| Level | Major | Minor | Minor | - |
To determine price objectives, it is also possible to use the pivot points. Here is the price position in relation to pivot points:
| Pivot points | S3 | S2 | S1 | PP | R1 | R2 | R3 |
|---|---|---|---|---|---|---|---|
| Standard | 0.595 | 0.625 | 0.655 | 0.685 | 0.715 | 0.745 | 0.775 |
| Camarilla | 0.669 | 0.674 | 0.680 | 0.685 | 0.691 | 0.696 | 0.702 |
| Woodie | 0.595 | 0.625 | 0.655 | 0.685 | 0.715 | 0.745 | 0.775 |
| Fibonacci | 0.625 | 0.648 | 0.662 | 0.685 | 0.708 | 0.722 | 0.745 |
| Pivot points | S3 | S2 | S1 | PP | R1 | R2 | R3 |
|---|---|---|---|---|---|---|---|
| Standard | 0.438 | 0.477 | 0.513 | 0.552 | 0.588 | 0.627 | 0.663 |
| Camarilla | 0.529 | 0.536 | 0.543 | 0.550 | 0.557 | 0.564 | 0.571 |
| Woodie | 0.438 | 0.476 | 0.513 | 0.551 | 0.588 | 0.626 | 0.663 |
| Fibonacci | 0.477 | 0.505 | 0.523 | 0.552 | 0.580 | 0.598 | 0.627 |
| Pivot points | S3 | S2 | S1 | PP | R1 | R2 | R3 |
|---|---|---|---|---|---|---|---|
| Standard | 0.082 | 0.223 | 0.432 | 0.573 | 0.782 | 0.923 | 1.132 |
| Camarilla | 0.544 | 0.576 | 0.608 | 0.640 | 0.672 | 0.704 | 0.736 |
| Woodie | 0.115 | 0.240 | 0.465 | 0.590 | 0.815 | 0.940 | 1.165 |
| Fibonacci | 0.223 | 0.357 | 0.440 | 0.573 | 0.707 | 0.790 | 0.923 |
Numerical data
The following is the status of the technical indicators and moving averages at the time of publication of this technical analysis:
| RSI (14): | 79.85 | |
| MACD (12,26,9): | 0.0590 | |
| Directional Movement: | 36.671 | |
| AROON (14): | 100.000 | |
| DEMA (21): | 0.630 | |
| Parabolic SAR (0,02-0,02-0,2): | 0.529 | |
| Elder Ray (13): | 0.097 | |
| Super Trend (3,10): | 0.544 | |
| Zig ZAG (10): | 0.685 | |
| VORTEX (21): | 1.2250 | |
| Stochastique (14,3,5): | 78.87 | |
| TEMA (21): | 0.654 | |
| Williams %R (14): | -13.64 | |
| Chande Momentum Oscillator (20): | 0.165 | |
| Repulse (5,40,3): | 8.7010 | |
| ROCnROLL: | 1 | |
| TRIX (15,9): | 1.5770 | |
| Courbe Coppock: | 50.24 |
| MA7: | 0.605 | |
| MA20: | 0.552 | |
| MA50: | 0.452 | |
| MA100: | 0.356 | |
| MAexp7: | 0.623 | |
| MAexp20: | 0.556 | |
| MAexp50: | 0.471 | |
| MAexp100: | 0.398 | |
| Price / MA7: | +13.22% | |
| Price / MA20: | +24.09% | |
| Price / MA50: | +51.55% | |
| Price / MA100: | +92.42% | |
| Price / MAexp7: | +9.95% | |
| Price / MAexp20: | +23.20% | |
| Price / MAexp50: | +45.44% | |
| Price / MAexp100: | +72.11% |
About author

Online


Add a comment
Comments
0 comments on the analysis ARGENICA THERAPEUTICS LIMITED - Daily