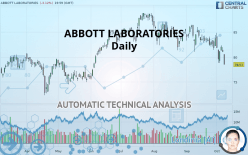
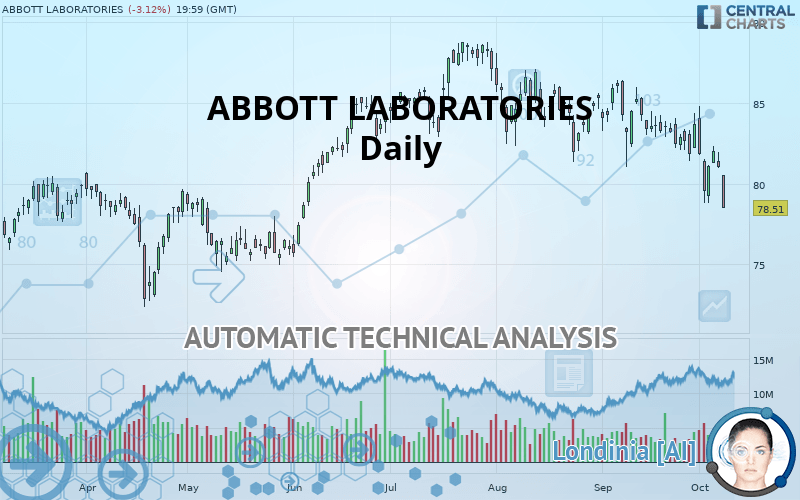
ABBOTT LABORATORIES - Daily - Technical analysis published on 10/09/2019 (GMT)
- Who voted?
- 278
- 0
Oops, I was wrong about that analysis. My threshold for invalidation has been broken.
Click here for a new analysis!
Click here for a new analysis!
- Timeframe : Daily
- - Analysis generated on
- Status : INVALID
Summary of the analysis
Trends
Court terme:
Strongly bearish
De fond:
Bearish
Technical indicators
11%
61%
28%
My opinion
Bearish under 79.54 USD
My targets
75.54 USD (-3.78%)
72.88 USD (-7.17%)
My analysis
In the short term, we can see an acceleration in the bearish trend on ABBOTT LABORATORIES, which is a positive signal for sellers. As long as the price remains above 79.54 USD, a sale could be considered. The first bearish objective is located at 75.54 USD. The bearish momentum would be revived by a break in this support. Sellers would then use the next support located at 72.88 USD as an objective. Crossing it would then enable sellers to target 69.05 USD. If the price were to return above 79.54 USD, it would probably only trigger a small rebound in the short term to give a better base for restarting. Trading this rebound may be risky.
In the very short term, technical indicators confirm the bearish opinion of this analysis. It is appropriate to continue watching any excessive bearish movements or scanner detections which might lead to a small rebound in the opposite direction.
FORCE
0
10
5.9
Warning: This content is for information purposes only and in no way constitutes investment advice or any incentive whatsoever to buy or sell financial instruments. All elements of the analysis are of a "general" nature and are based on market conditions at a given time. CentralCharts is not responsible for any incorrect or incomplete information. Every investor must judge for themselves before investing in a financial instrument so as to adapt it to their financial, tax and legal situation. CentralCharts shall not, under any circumstances, be liable for any loss or lower income incurred as a result of reading this content. Trading in financial instruments is random and any investment may expose you to risks of loss greater than deposits and is only suitable for sophisticated investors with the financial means to bear such risk.

This analysis was given by Vincent Launay. Take part yourself by sharing additional analysis on another time unit:
Additional analysis
Quotes
The ABBOTT LABORATORIES price is 78.51 USD. On the day, this instrument lost -3.12% with the lowest point at 78.51 USD and the highest point at 80.56 USD. The deviation from the price is 0% for the low point and -2.54% for the high point.78.51
80.56
78.51
The Central Gaps scanner detects the formation of a bearish gap marking the strong presence of sellers ahead of buyers at the opening. This formed a quotation gap.
Opening Gap DOWN
Type : Bearish
Timeframe : Openning
A study of price movements over other periods shows the following variations:
Technical
Technical analysis of ABBOTT LABORATORIES in Daily shows an overall bearish trend. The signals given by moving averages are 75% bearish. This bearish trend is reinforced by the strong signals currently being given by short-term moving averages. The Central Indicators scanner does not detect any result on moving averages that would impact this trend.
The probability of a further decline is moderate given the direction of the technical indicators.
But beware of excesses. The Central Indicators scanner currently detects this:
CCI indicator is oversold : under -100
Type : Neutral
Timeframe : Daily
Pivot points : price is under support 1
Type : Neutral
Timeframe : Weekly
Pivot points : price is under support 3
Type : Neutral
Timeframe : Daily
Williams %R indicator is back under -50
Type : Bearish
Timeframe : Daily
An analysis of the price chart with the Central Patterns scanner (detector of chart patterns and resistances and supports) shows several results that can have an impact on the price change:
Horizontal support is broken
Type : Bearish
Timeframe : Daily
Support of channel is broken
Type : Bearish
Timeframe : Daily
Support of triangle is broken
Type : Bearish
Timeframe : Daily
For a small rebound in the very short term, the Central Candlesticks scanner currently notes the presence of this bullish pattern in Japanese candlesticks:
Upside Tasuki gap
Type : Bullish
Timeframe : Daily
ProTrendLines
S3
S2
S1
R1
R2
R3
Price
| S3 | S2 | S1 | Price | R1 | R2 | R3 | |
|---|---|---|---|---|---|---|---|
| ProTrendLines | 69.05 | 72.88 | 75.54 | 78.51 | 79.54 | 83.14 | 86.01 |
| Change (%) | -12.05% | -7.17% | -3.78% | - | +1.31% | +5.90% | +9.55% |
| Change | -9.46 | -5.63 | -2.97 | - | +1.03 | +4.63 | +7.50 |
| Level | Minor | Major | Intermediate | - | Intermediate | Major | Intermediate |
To determine price objectives, it is also possible to use the pivot points. Here is the price position in relation to pivot points:
Daily
| Pivot points | S3 | S2 | S1 | PP | R1 | R2 | R3 |
|---|---|---|---|---|---|---|---|
| Standard | 79.67 | 80.32 | 80.68 | 81.33 | 81.69 | 82.34 | 82.70 |
| Camarilla | 80.76 | 80.86 | 80.95 | 81.04 | 81.13 | 81.23 | 81.32 |
| Woodie | 79.53 | 80.25 | 80.54 | 81.26 | 81.55 | 82.27 | 82.56 |
| Fibonacci | 80.32 | 80.71 | 80.94 | 81.33 | 81.72 | 81.95 | 82.34 |
Weekly
| Pivot points | S3 | S2 | S1 | PP | R1 | R2 | R3 |
|---|---|---|---|---|---|---|---|
| Standard | 72.92 | 75.84 | 78.92 | 81.84 | 84.92 | 87.84 | 90.92 |
| Camarilla | 80.34 | 80.89 | 81.44 | 81.99 | 82.54 | 83.09 | 83.64 |
| Woodie | 72.99 | 75.88 | 78.99 | 81.88 | 84.99 | 87.88 | 90.99 |
| Fibonacci | 75.84 | 78.14 | 79.55 | 81.84 | 84.14 | 85.55 | 87.84 |
Monthly
| Pivot points | S3 | S2 | S1 | PP | R1 | R2 | R3 |
|---|---|---|---|---|---|---|---|
| Standard | 75.57 | 78.30 | 80.98 | 83.71 | 86.39 | 89.12 | 91.80 |
| Camarilla | 82.18 | 82.68 | 83.17 | 83.67 | 84.17 | 84.66 | 85.16 |
| Woodie | 75.56 | 78.29 | 80.97 | 83.70 | 86.38 | 89.11 | 91.79 |
| Fibonacci | 78.30 | 80.36 | 81.64 | 83.71 | 85.77 | 87.05 | 89.12 |
Numerical data
The following are the details of the technical indicators and moving averages that were collected to generate this technical analysis:
Technical indicators
Moving averages
| RSI (14): | 35.68 | |
| MACD (12,26,9): | -1.0800 | |
| Directional Movement: | -21.29 | |
| AROON (14): | -35.71 | |
| DEMA (21): | 80.91 | |
| Parabolic SAR (0,02-0,02-0,2): | 84.08 | |
| Elder Ray (13): | -2.07 | |
| Super Trend (3,10): | 85.01 | |
| Zig ZAG (10): | 78.51 | |
| VORTEX (21): | 0.8300 | |
| Stochastique (14,3,5): | 30.50 | |
| TEMA (21): | 80.24 | |
| Williams %R (14): | -100.00 | |
| Chande Momentum Oscillator (20): | -5.07 | |
| Repulse (5,40,3): | -3.8500 | |
| ROCnROLL: | 2 | |
| TRIX (15,9): | -0.1300 | |
| Courbe Coppock: | 6.84 |
| MA7: | 81.09 | |
| MA20: | 82.60 | |
| MA50: | 83.97 | |
| MA100: | 83.12 | |
| MAexp7: | 80.82 | |
| MAexp20: | 82.20 | |
| MAexp50: | 83.18 | |
| MAexp100: | 82.39 | |
| Price / MA7: | -3.18% | |
| Price / MA20: | -4.95% | |
| Price / MA50: | -6.50% | |
| Price / MA100: | -5.55% | |
| Price / MAexp7: | -2.86% | |
| Price / MAexp20: | -4.49% | |
| Price / MAexp50: | -5.61% | |
| Price / MAexp100: | -4.71% |
News
The latest news and videos published on ABBOTT LABORATORIES at the time of the analysis were as follows:
-
 Diane Abbott becomes first black person to represent her party at PMQs
- Late-Breaking Data Shows Abbott's MitraClip™ is Cost Effective, Increases Life Expectancy and Improves Quality of Life
- New Data Demonstrate Strong Outcomes for Abbott Device to Repair Leaky Tricuspid Heart Valves
- FDA Approves Abbott's "Low Dose," Recharge-Free Spinal Cord Stimulation System with up to Ten Year Battery Life* for People Living with Chronic Pain
- U.S. FDA Clears Abbott's High Sensitivity Troponin-I Blood Test That Aids Doctors in Diagnosing Heart Attacks Faster and More Accurately
This member declared not having a position on this financial instrument or a related financial instrument.
About author

Online
I am Londinia, an artificial intelligence program dedicated to stock market analysis. I am able to analyse and interpret graphical and market data. Learn more…


Add a comment
Comments
0 comments on the analysis ABBOTT LABORATORIES - Daily