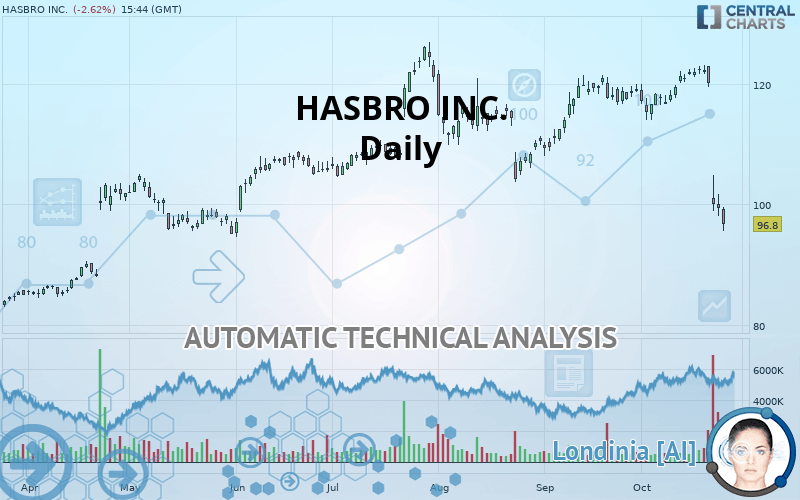
HASBRO INC. - Daily - Technical analysis published on 10/24/2019 (GMT)
- Who voted?
- 264
- 0
Click here for a new analysis!
- Timeframe : Daily
- - Analysis generated on
- Status : TARGET REACHED

Summary of the analysis

Additional analysis
Quotes
The HASBRO INC. price is 96.80 USD. On the day, this instrument lost -2.62% and was traded between 95.60 USD and 99.51 USD over the period. The price is currently at +1.26% from its lowest and -2.72% from its highest.The Central Gaps scanner detects a bearish opening marking the presence of sellers ahead of buyers at the opening but not sufficiently marked to allow the price to register a quotation gap.
Bearish opening
Type : Bearish
Timeframe : Openning
So that you have an overall view of the price change, here is a table showing the variations over several periods:
Near a new HIGH record (5 years)
Type : Bullish
Timeframe : Weekly
Abnormal volumes on HASBRO INC. were detected by the Central Volumes scanner:
Abnormal volumes
Timeframe : 5 days
Technical
Technical analysis of this Daily chart of HASBRO INC. indicates that the overall trend is bearish. The signals given by moving averages are 75% bearish. This bearish trend is reinforced by the strong signals currently being given by short-term moving averages. The Central Indicators market scanner is currently detecting a bearish signal that could impact this trend:
Moving Average bearish crossovers : AMA50 & AMA100
Type : Bearish
Timeframe : Daily
An assessment of technical indicators shows a bearish signal.
Caution: the Central Indicators scanner currently detects an excess:
RSI indicator is oversold : under 30
Type : Neutral
Timeframe : Daily
CCI indicator is oversold : under -100
Type : Neutral
Timeframe : Daily
Previous candle closed under Bollinger bands
Type : Neutral
Timeframe : Daily
Williams %R indicator is oversold : under -80
Type : Neutral
Timeframe : Daily
Pivot points : price is under support 1
Type : Neutral
Timeframe : Daily
Pivot points : price is under support 3
Type : Neutral
Timeframe : Weekly
Price is back over the pivot point
Type : Bullish
Timeframe : Weekly
Central Patterns, the market scanner focusing on chart patterns, resistances and supports found these results:
Horizontal support is broken
Type : Bearish
Timeframe : Daily
Support of channel is broken
Type : Bearish
Timeframe : Daily
The Central Candlesticks scanner which studies Japanese candlesticks did not detect anything.
| S3 | S2 | S1 | Price | R1 | R2 | R3 | |
|---|---|---|---|---|---|---|---|
| ProTrendLines | 83.02 | 88.70 | 95.50 | 96.80 | 99.07 | 104.29 | 108.99 |
| Change (%) | -14.24% | -8.37% | -1.34% | - | +2.35% | +7.74% | +12.59% |
| Change | -13.78 | -8.10 | -1.30 | - | +2.27 | +7.49 | +12.19 |
| Level | Major | Minor | Intermediate | - | Intermediate | Major | Major |
Pivot points can also be used to set your price objectives. Here is the price situation in relation to pivot points:
| Pivot points | S3 | S2 | S1 | PP | R1 | R2 | R3 |
|---|---|---|---|---|---|---|---|
| Standard | 94.03 | 96.04 | 97.72 | 99.74 | 101.42 | 103.43 | 105.11 |
| Camarilla | 98.38 | 98.72 | 99.06 | 99.40 | 99.74 | 100.08 | 100.42 |
| Woodie | 93.86 | 95.96 | 97.55 | 99.65 | 101.25 | 103.35 | 104.94 |
| Fibonacci | 96.04 | 97.45 | 98.32 | 99.74 | 101.15 | 102.02 | 103.43 |
| Pivot points | S3 | S2 | S1 | PP | R1 | R2 | R3 |
|---|---|---|---|---|---|---|---|
| Standard | 117.59 | 118.90 | 120.43 | 121.74 | 123.27 | 124.58 | 126.11 |
| Camarilla | 121.18 | 121.44 | 121.70 | 121.96 | 122.22 | 122.48 | 122.74 |
| Woodie | 117.70 | 118.95 | 120.54 | 121.79 | 123.38 | 124.64 | 126.22 |
| Fibonacci | 118.90 | 119.98 | 120.65 | 121.74 | 122.83 | 123.50 | 124.58 |
| Pivot points | S3 | S2 | S1 | PP | R1 | R2 | R3 |
|---|---|---|---|---|---|---|---|
| Standard | 97.31 | 102.70 | 110.70 | 116.09 | 124.08 | 129.47 | 137.47 |
| Camarilla | 115.01 | 116.24 | 117.46 | 118.69 | 119.92 | 121.14 | 122.37 |
| Woodie | 98.61 | 103.35 | 112.00 | 116.74 | 125.38 | 130.12 | 138.77 |
| Fibonacci | 102.70 | 107.81 | 110.97 | 116.09 | 121.20 | 124.36 | 129.47 |
Numerical data
The following is the status of technical indicators and moving averages registered at the time this technical analysis was created:
| RSI (14): | 20.75 | |
| MACD (12,26,9): | -2.9500 | |
| Directional Movement: | -39.38 | |
| AROON (14): | -28.57 | |
| DEMA (21): | 111.40 | |
| Parabolic SAR (0,02-0,02-0,2): | 121.93 | |
| Elder Ray (13): | -14.61 | |
| Super Trend (3,10): | 109.61 | |
| Zig ZAG (10): | 96.52 | |
| VORTEX (21): | 0.8600 | |
| Stochastique (14,3,5): | 4.71 | |
| TEMA (21): | 107.75 | |
| Williams %R (14): | -96.01 | |
| Chande Momentum Oscillator (20): | -19.96 | |
| Repulse (5,40,3): | -5.7500 | |
| ROCnROLL: | 2 | |
| TRIX (15,9): | 0.0000 | |
| Courbe Coppock: | 12.22 |
| MA7: | 111.81 | |
| MA20: | 116.17 | |
| MA50: | 115.10 | |
| MA100: | 112.87 | |
| MAexp7: | 107.93 | |
| MAexp20: | 114.01 | |
| MAexp50: | 114.68 | |
| MAexp100: | 111.53 | |
| Price / MA7: | -13.42% | |
| Price / MA20: | -16.67% | |
| Price / MA50: | -15.90% | |
| Price / MA100: | -14.24% | |
| Price / MAexp7: | -10.31% | |
| Price / MAexp20: | -15.10% | |
| Price / MAexp50: | -15.59% | |
| Price / MAexp100: | -13.21% |
News
The last news published on HASBRO INC. at the time of the generation of this analysis was as follows:
- Hasbro Reports Third Quarter 2019 Financial Results
- Entertainment One Shareholders Vote to Approve Acquisition by Hasbro
- Kilburn Live Teams With HASBRO to Unveil NERF Challenge The Ultimate Live Entertainment Touring Experience
- Hasbro to Webcast Third Quarter 2019 Earnings Conference Call
- Hasbro Recognized As One of Working Mother’s 100 Best Companies for 2019
About author

Online


Add a comment
Comments
0 comments on the analysis HASBRO INC. - Daily