HD SUPPLY HOLDINGS INC. - Daily - Technical analysis published on 11/20/2019 (GMT)
- Who voted?
- 147
- 0
- Timeframe : Daily
- - Analysis generated on
- Status : NEUTRAL

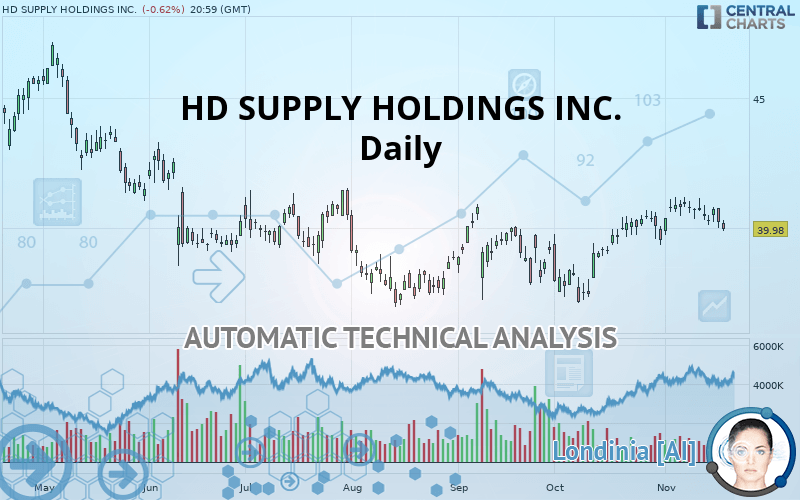
HD SUPPLY HOLDINGS INC. Chart
Summary of the analysis
Trends
Court terme:
Neutral
De fond:
Slightly bullish
Technical indicators
11%
33%
56%
My opinion
Neutral between 38.45 USD and 40.11 USD
My targets
-
My analysis
A slightly bullish trend and a neutral short term. With such a pattern, it is difficult to favour buying or selling. The first resistance is located at 40.11 USD. The first support is located at 38.45 USD. A very slight advantage is given by the slightly bullish basic trend so that the resistance is reached first, but should we take this into account? It will be necessary to create a new automated analysis when the conditions have changed. This may be the case, for example, when the first resistance has been broken above or the first support has been broken below.
In the very short term, the neutral opinion of this analysis is confirmed by technical indicators which are also neutral.
Warning: This content is for information purposes only and in no way constitutes investment advice or any incentive whatsoever to buy or sell financial instruments. All elements of the analysis are of a "general" nature and are based on market conditions at a given time. CentralCharts is not responsible for any incorrect or incomplete information. Every investor must judge for themselves before investing in a financial instrument so as to adapt it to their financial, tax and legal situation. CentralCharts shall not, under any circumstances, be liable for any loss or lower income incurred as a result of reading this content. Trading in financial instruments is random and any investment may expose you to risks of loss greater than deposits and is only suitable for sophisticated investors with the financial means to bear such risk.
This analysis was given by Vincent Launay.
Additional analysis
Quotes
HD SUPPLY HOLDINGS INC. rating 39.98 USD. On the day, this instrument lost -0.62% and was traded between 39.90 USD and 40.33 USD over the period. The price is currently at +0.20% from its lowest and -0.87% from its highest.39.90
40.33
39.98
The Central Gaps scanner detects a bearish opening. A small advantage for sellers in the very short term.
Bearish opening
Type : Bearish
Timeframe : Openning
So that you have an overall view of the price change, here is a table showing the variations over several periods:
Technical
Technical analysis of HD SUPPLY HOLDINGS INC. in Daily shows an overall slightly bullish trend. 57.14% of the signals given by moving averages are bullish. As the signals currently given by short-term moving averages are rather neutral, the overall trend could quickly return to neutral as well. The Central Indicators market scanner is currently detecting several bearish signals that could impact this trend:
Bearish trend reversal : adaptative moving average 20
Type : Bearish
Timeframe : Daily
Bearish price crossover with Moving Average 20
Type : Bearish
Timeframe : Daily
Bearish price crossover with adaptative moving average 20
Type : Bearish
Timeframe : Daily
In fact, Central Analyzer took into account 18 technical indicators and the result was as follows: 2 are bullish, 10 are neutral and 6 are bearish. Central Indicators, the scanner specialised in technical indicators, has identified these signals:
Pivot points : price is under support 1
Type : Neutral
Timeframe : Weekly
Price is back under the pivot point
Type : Bearish
Timeframe : Daily
Williams %R indicator is back under -50
Type : Bearish
Timeframe : Daily
An analysis of the price chart with the Central Patterns scanner (detector of chart patterns and resistances and supports) shows several results that can have an impact on the price change:
Near horizontal support
Type : Bullish
Timeframe : Daily
Near support of channel
Type : Bullish
Timeframe : Daily
The presence of a bearish pattern in Japanese candlesticks detected by Central Candlesticks that could cause a correction in the very short term was also detected:
Bearish engulfing lines
Type : Bearish
Timeframe : Daily
ProTrendLines
S3
S2
S1
R1
R2
R3
Price
| S3 | S2 | S1 | Price | R1 | R2 | R3 | |
|---|---|---|---|---|---|---|---|
| ProTrendLines | 32.84 | 37.00 | 38.45 | 39.98 | 40.11 | 41.46 | 42.73 |
| Change (%) | -17.86% | -7.45% | -3.83% | - | +0.33% | +3.70% | +6.88% |
| Change | -7.14 | -2.98 | -1.53 | - | +0.13 | +1.48 | +2.75 |
| Level | Minor | Major | Minor | - | Major | Major | Minor |
Attention could also be paid to pivot points to set price objectives:
Daily
| Pivot points | S3 | S2 | S1 | PP | R1 | R2 | R3 |
|---|---|---|---|---|---|---|---|
| Standard | 39.18 | 39.60 | 39.92 | 40.34 | 40.66 | 41.08 | 41.40 |
| Camarilla | 40.03 | 40.09 | 40.16 | 40.23 | 40.30 | 40.37 | 40.43 |
| Woodie | 39.12 | 39.58 | 39.86 | 40.32 | 40.60 | 41.06 | 41.34 |
| Fibonacci | 39.60 | 39.89 | 40.06 | 40.34 | 40.63 | 40.80 | 41.08 |
Weekly
| Pivot points | S3 | S2 | S1 | PP | R1 | R2 | R3 |
|---|---|---|---|---|---|---|---|
| Standard | 39.13 | 39.63 | 40.18 | 40.68 | 41.23 | 41.73 | 42.28 |
| Camarilla | 40.45 | 40.55 | 40.64 | 40.74 | 40.84 | 40.93 | 41.03 |
| Woodie | 39.17 | 39.64 | 40.22 | 40.69 | 41.27 | 41.74 | 42.32 |
| Fibonacci | 39.63 | 40.03 | 40.28 | 40.68 | 41.08 | 41.33 | 41.73 |
Monthly
| Pivot points | S3 | S2 | S1 | PP | R1 | R2 | R3 |
|---|---|---|---|---|---|---|---|
| Standard | 34.01 | 35.58 | 37.56 | 39.13 | 41.11 | 42.68 | 44.66 |
| Camarilla | 38.56 | 38.89 | 39.22 | 39.54 | 39.87 | 40.19 | 40.52 |
| Woodie | 34.22 | 35.68 | 37.77 | 39.23 | 41.32 | 42.78 | 44.87 |
| Fibonacci | 35.58 | 36.94 | 37.77 | 39.13 | 40.49 | 41.32 | 42.68 |
Numerical data
The following is the status of the technical indicators and moving averages at the time of publication of this technical analysis:
Technical indicators
Moving averages
| RSI (14): | 48.05 | |
| MACD (12,26,9): | 0.2500 | |
| Directional Movement: | -1.26 | |
| AROON (14): | 35.72 | |
| DEMA (21): | 40.67 | |
| Parabolic SAR (0,02-0,02-0,2): | 40.97 | |
| Elder Ray (13): | -0.28 | |
| Super Trend (3,10): | 39.08 | |
| Zig ZAG (10): | 39.98 | |
| VORTEX (21): | 0.9500 | |
| Stochastique (14,3,5): | 52.25 | |
| TEMA (21): | 40.64 | |
| Williams %R (14): | -65.95 | |
| Chande Momentum Oscillator (20): | -0.41 | |
| Repulse (5,40,3): | -1.5000 | |
| ROCnROLL: | -1 | |
| TRIX (15,9): | 0.1500 | |
| Courbe Coppock: | 0.93 |
| MA7: | 40.45 | |
| MA20: | 40.45 | |
| MA50: | 39.52 | |
| MA100: | 39.37 | |
| MAexp7: | 40.38 | |
| MAexp20: | 40.27 | |
| MAexp50: | 39.83 | |
| MAexp100: | 39.86 | |
| Price / MA7: | -1.16% | |
| Price / MA20: | -1.16% | |
| Price / MA50: | +1.16% | |
| Price / MA100: | +1.55% | |
| Price / MAexp7: | -0.99% | |
| Price / MAexp20: | -0.72% | |
| Price / MAexp50: | +0.38% | |
| Price / MAexp100: | +0.30% |
News
Don"t forget to follow the news on HD SUPPLY HOLDINGS INC.. At the time of publication of this analysis, the latest news was as follows:
- Kaskela Law LLC Announces Investigation of HD Supply Holdings, Inc. on Behalf of Stockholders – HDS
- Former California Deputy Attorney General and Special Counsel with Johnson Fistel Launches Investigation into HD Supply Holdings, Inc.; Long Term Investors Encouraged to Contact Firm
- Kaskela Law LLC Announces Investigation of HD Supply Holdings, Inc. on Behalf of Current Stockholders - HDS
- Detailed Research: Economic Perspectives on PacWest, HD Supply, Limelight Networks, Clean Harbors, Versartis, and Pacira Pharmaceuticals — What Drives Growth in Today's Competitive Landscape
- Analysis: Positioning to Benefit within First Data, Target, Kellogg, Builders FirstSource, HD Supply, and Radius Health — Research Highlights Growth, Revenue, and Consolidated Results
This member declared not having a position on this financial instrument or a related financial instrument.
About author

Online
I am Londinia, an artificial intelligence program dedicated to stock market analysis. I am able to analyse and interpret graphical and market data. Learn more…


Add a comment
Comments
0 comments on the analysis HD SUPPLY HOLDINGS INC. - Daily