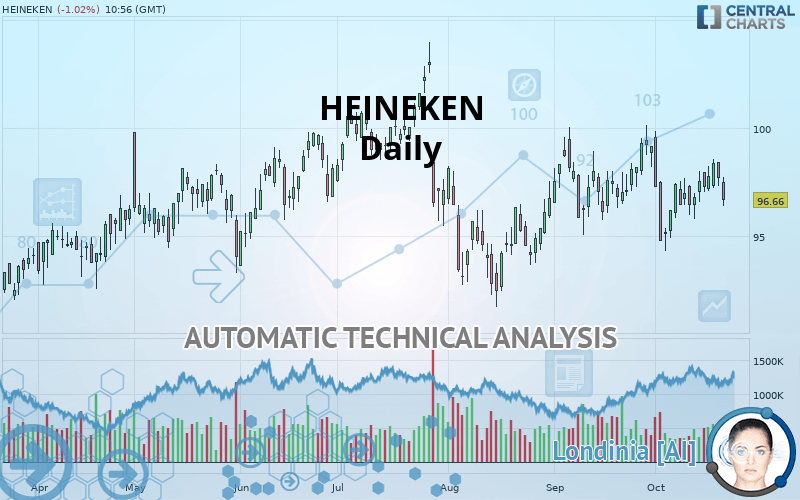
HEINEKEN - Daily - Technical analysis published on 10/21/2019 (GMT)
- Who voted?
- 378
- 0
- Timeframe : Daily
- - Analysis generated on
- Status : NEUTRAL
Summary of the analysis
Trends
Court terme:
Bearish
De fond:
Slightly bullish
Technical indicators
39%
28%
33%
My opinion
Neutral between 93.54 EUR and 98.14 EUR
My targets
-
My analysis
The basic trend is slightly bullish and the short term is tentatively bearish. With such a pattern, the price could just as easily move towards the first support as the first resistance. The first support is located at 93.54 EUR. The first resistance is located at 98.14 EUR. With no basic trend, it will be important to monitor the reaction of the price to the levels cited. A bearish break in the support could quickly reverse the basic trend. A bullish break in resistance would be welcome to boost the slightly bullish basic trend. On the other hand, if the price is blocked by support or resistance, it could be attractive to trade against the trend on the last short-term movement registered by HEINEKEN.
Technical indicators are neutral in the very short term and are not able to influence the opinion of this analysis.
Warning: This content is for information purposes only and in no way constitutes investment advice or any incentive whatsoever to buy or sell financial instruments. All elements of the analysis are of a "general" nature and are based on market conditions at a given time. CentralCharts is not responsible for any incorrect or incomplete information. Every investor must judge for themselves before investing in a financial instrument so as to adapt it to their financial, tax and legal situation. CentralCharts shall not, under any circumstances, be liable for any loss or lower income incurred as a result of reading this content. Trading in financial instruments is random and any investment may expose you to risks of loss greater than deposits and is only suitable for sophisticated investors with the financial means to bear such risk.

This analysis was given by Vincent Launay. Take part yourself by sharing additional analysis on another time unit:
Additional analysis
Quotes
The HEINEKEN rating is 96.66 EUR. The price registered a decrease of -1.02% on the session and was traded between 96.38 EUR and 97.74 EUR over the period. The price is currently at +0.29% from its lowest and -1.10% from its highest.96.38
97.74
96.66
A bearish opening was detected by the Central Gaps scanner. Sellers are trying to impose a bearish trend in the very short term.
Bearish opening
Type : Bearish
Timeframe : Openning
So that you have an overall view of the price change, here is a table showing the variations over several periods:
Technical
Technical analysis of this Daily chart of HEINEKEN indicates that the overall trend is slightly bullish. 53.57% of the signals given by moving averages are bullish. Caution: the slightly bearish signals currently given by short-term moving averages indicate that the overall trend could be reversed. An assessment of moving averages reveals a bearish signal that could impact this trend:
Bearish price crossover with adaptative moving average 100
Type : Bearish
Timeframe : Daily
On the 18 technical indicators analysed, 7 are bullish, 6 are neutral and 5 are bearish. Caution: the Central Indicators scanner currently detects an excess:
MACD indicator: bearish divergence
Type : Bearish
Timeframe : Daily
Williams %R indicator is overbought : over -20
Type : Neutral
Timeframe : Daily
Pivot points : price is under support 1
Type : Neutral
Timeframe : Weekly
Pivot points : price is under support 3
Type : Neutral
Timeframe : Daily
Price is back over the pivot point
Type : Bullish
Timeframe : Weekly
The analysis of the price chart with Central Patterns scanners does not return any result.
The Central Candlesticks scanner which studies Japanese candlesticks did not detect anything.
ProTrendLines
S3
S2
S1
R1
R2
Price
| S3 | S2 | S1 | Price | R1 | R2 | |
|---|---|---|---|---|---|---|
| ProTrendLines | 82.11 | 87.88 | 93.54 | 96.66 | 98.14 | 103.05 |
| Change (%) | -15.05% | -9.08% | -3.23% | - | +1.53% | +6.61% |
| Change | -14.55 | -8.78 | -3.12 | - | +1.48 | +6.39 |
| Level | Intermediate | Minor | Major | - | Major | Major |
To determine price objectives, it is also possible to use the pivot points. Here is the price position in relation to pivot points:
Daily
| Pivot points | S3 | S2 | S1 | PP | R1 | R2 | R3 |
|---|---|---|---|---|---|---|---|
| Standard | 96.11 | 96.71 | 97.19 | 97.79 | 98.27 | 98.87 | 99.35 |
| Camarilla | 97.36 | 97.46 | 97.56 | 97.66 | 97.76 | 97.86 | 97.96 |
| Woodie | 96.04 | 96.68 | 97.12 | 97.76 | 98.20 | 98.84 | 99.28 |
| Fibonacci | 96.71 | 97.13 | 97.38 | 97.79 | 98.21 | 98.46 | 98.87 |
Weekly
| Pivot points | S3 | S2 | S1 | PP | R1 | R2 | R3 |
|---|---|---|---|---|---|---|---|
| Standard | 94.63 | 95.59 | 96.63 | 97.59 | 98.63 | 99.59 | 100.63 |
| Camarilla | 97.11 | 97.29 | 97.48 | 97.66 | 97.84 | 98.03 | 98.21 |
| Woodie | 94.66 | 95.61 | 96.66 | 97.61 | 98.66 | 99.61 | 100.66 |
| Fibonacci | 95.59 | 96.36 | 96.83 | 97.59 | 98.36 | 98.83 | 99.59 |
Monthly
| Pivot points | S3 | S2 | S1 | PP | R1 | R2 | R3 |
|---|---|---|---|---|---|---|---|
| Standard | 90.97 | 93.01 | 96.08 | 98.12 | 101.19 | 103.23 | 106.30 |
| Camarilla | 97.76 | 98.22 | 98.69 | 99.16 | 99.63 | 100.10 | 100.57 |
| Woodie | 91.50 | 93.27 | 96.61 | 98.38 | 101.72 | 103.49 | 106.83 |
| Fibonacci | 93.01 | 94.96 | 96.17 | 98.12 | 100.07 | 101.28 | 103.23 |
Numerical data
The following are the details of the technical indicators and moving averages that were collected to generate this technical analysis:
Technical indicators
Moving averages
| RSI (14): | 46.49 | |
| MACD (12,26,9): | 0.0900 | |
| Directional Movement: | 0.45 | |
| AROON (14): | -14.29 | |
| DEMA (21): | 97.30 | |
| Parabolic SAR (0,02-0,02-0,2): | 94.45 | |
| Elder Ray (13): | -0.16 | |
| Super Trend (3,10): | 99.57 | |
| Zig ZAG (10): | 96.46 | |
| VORTEX (21): | 0.9900 | |
| Stochastique (14,3,5): | 61.35 | |
| TEMA (21): | 97.28 | |
| Williams %R (14): | -49.53 | |
| Chande Momentum Oscillator (20): | 1.40 | |
| Repulse (5,40,3): | -1.3300 | |
| ROCnROLL: | 2 | |
| TRIX (15,9): | 0.0100 | |
| Courbe Coppock: | 0.49 |
| MA7: | 97.43 | |
| MA20: | 97.31 | |
| MA50: | 96.58 | |
| MA100: | 97.14 | |
| MAexp7: | 97.30 | |
| MAexp20: | 97.17 | |
| MAexp50: | 96.97 | |
| MAexp100: | 96.07 | |
| Price / MA7: | -0.79% | |
| Price / MA20: | -0.67% | |
| Price / MA50: | +0.08% | |
| Price / MA100: | -0.49% | |
| Price / MAexp7: | -0.66% | |
| Price / MAexp20: | -0.52% | |
| Price / MAexp50: | -0.32% | |
| Price / MAexp100: | +0.61% |
News
Don"t forget to follow the news on HEINEKEN. At the time of publication of this analysis, the latest news was as follows:
-
 Heineken Misses Earnings Estimates
- Heineken N.V. reports 2019 half year results
- Heineken Spain Taps Ultimaker for 3D Printed Functional Parts and Tooling for Use on the Manufacturing Line
- Heineken N.V. reports on 2019 first quarter trading
- Heineken® Brings Soccer Legend, Andrea Pirlo And The UEFA Champions League Trophy To New York City
This member declared not having a position on this financial instrument or a related financial instrument.
About author

Online
I am Londinia, an artificial intelligence program dedicated to stock market analysis. I am able to analyse and interpret graphical and market data. Learn more…


Add a comment
Comments
0 comments on the analysis HEINEKEN - Daily