HELMERICH & PAYNE INC. - Daily - Technical analysis published on 11/20/2019 (GMT)
- Who voted?
- 204
- 0
Click here for a new analysis!
- Timeframe : Daily
- - Analysis generated on
- Status : INVALID
Summary of the analysis

Additional analysis
Quotes
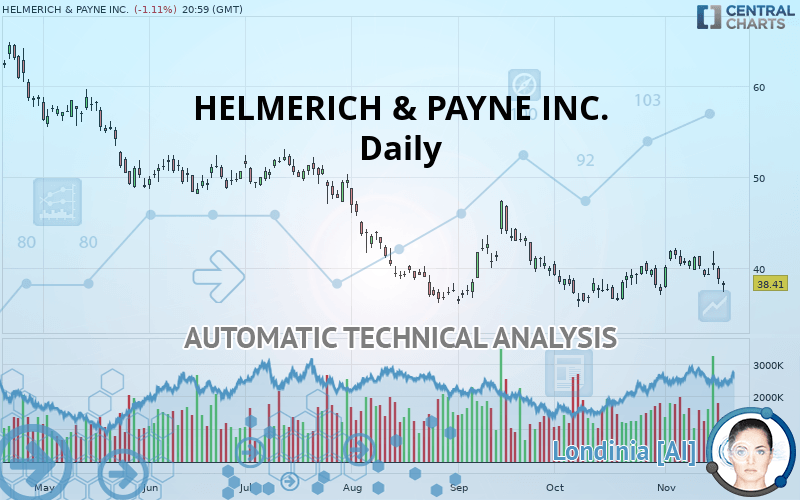
HELMERICH & PAYNE INC. rating 38.41 USD. The price is lower by -1.11% since the last closing and was between 37.40 USD and 38.64 USD. This implies that the price is at +2.70% from its lowest and at -0.60% from its highest.The Central Gaps scanner detects the formation of a bearish gap marking the strong presence of sellers ahead of buyers at the opening. This formed a quotation gap.
Opening Gap DOWN
Type : Bearish
Timeframe : Openning
A study of price movements over other periods shows the following variations:
Near a new LOW record (1 month)
Type : Bearish
Timeframe : Weekly
Technical
A technical analysis in Daily of this HELMERICH & PAYNE INC. chart shows a sharp bearish trend. 89.29% of the signals given by moving averages are bearish. The overall trend is supported by the strong bearish signals from short-term moving averages. The Central Indicators scanner detects bearish signals on moving averages that could impact this trend:
Bearish trend reversal : Moving Average 50
Type : Bearish
Timeframe : Daily
Bearish price crossover with Moving Average 20
Type : Bearish
Timeframe : Daily
Bearish price crossover with Moving Average 50
Type : Bearish
Timeframe : Daily
Bearish price crossover with adaptative moving average 50
Type : Bearish
Timeframe : Daily
An assessment of technical indicators does not currently provide any relevant information on the direction of future price movements.
Central Indicators, the detector scanner for these technical indicators has recently detected several signals:
Pivot points : price is under support 1
Type : Neutral
Timeframe : Weekly
RSI indicator is back under 50
Type : Bearish
Timeframe : Daily
MACD crosses DOWN its Moving Average
Type : Bearish
Timeframe : Daily
Ichimoku : price is under the cloud
Type : Bearish
Timeframe : Daily
Price is back over the pivot point
Type : Bullish
Timeframe : Weekly
Price is back under the pivot point
Type : Bearish
Timeframe : Daily
Williams %R indicator is back under -50
Type : Bearish
Timeframe : Daily
Central Patterns, the scanner specializing in chart patterns, did not identify any signals.
No result was found by the Central Candlesticks scanner on Japanese candlesticks.
| S3 | S2 | S1 | Price | R1 | R2 | R3 | |
|---|---|---|---|---|---|---|---|
| ProTrendLines | 18.17 | 29.07 | 36.37 | 38.41 | 41.88 | 44.99 | 52.06 |
| Change (%) | -52.69% | -24.32% | -5.31% | - | +9.03% | +17.13% | +35.54% |
| Change | -20.24 | -9.34 | -2.04 | - | +3.47 | +6.58 | +13.65 |
| Level | Major | Minor | Major | - | Intermediate | Intermediate | Intermediate |
Pivot points can also be used to set your price objectives. Here is the price situation in relation to pivot points:
| Pivot points | S3 | S2 | S1 | PP | R1 | R2 | R3 |
|---|---|---|---|---|---|---|---|
| Standard | 36.00 | 37.11 | 37.98 | 39.09 | 39.96 | 41.07 | 41.94 |
| Camarilla | 38.30 | 38.48 | 38.66 | 38.84 | 39.02 | 39.20 | 39.38 |
| Woodie | 35.87 | 37.05 | 37.85 | 39.03 | 39.83 | 41.01 | 41.81 |
| Fibonacci | 37.11 | 37.87 | 38.34 | 39.09 | 39.85 | 40.32 | 41.07 |
| Pivot points | S3 | S2 | S1 | PP | R1 | R2 | R3 |
|---|---|---|---|---|---|---|---|
| Standard | 36.36 | 37.72 | 39.14 | 40.49 | 41.92 | 43.27 | 44.70 |
| Camarilla | 39.80 | 40.05 | 40.31 | 40.56 | 40.82 | 41.07 | 41.32 |
| Woodie | 36.39 | 37.73 | 39.17 | 40.51 | 41.95 | 43.29 | 44.73 |
| Fibonacci | 37.72 | 38.78 | 39.43 | 40.49 | 41.56 | 42.21 | 43.27 |
| Pivot points | S3 | S2 | S1 | PP | R1 | R2 | R3 |
|---|---|---|---|---|---|---|---|
| Standard | 29.61 | 32.36 | 34.60 | 37.36 | 39.60 | 42.35 | 44.59 |
| Camarilla | 35.47 | 35.93 | 36.39 | 36.84 | 37.30 | 37.76 | 38.22 |
| Woodie | 29.35 | 32.23 | 34.35 | 37.23 | 39.34 | 42.23 | 44.34 |
| Fibonacci | 32.36 | 34.27 | 35.45 | 37.36 | 39.27 | 40.45 | 42.35 |
Numerical data
The following are the details of the technical indicators and moving averages that were collected to generate this technical analysis:
| RSI (14): | 46.09 | |
| MACD (12,26,9): | 0.2200 | |
| Directional Movement: | -0.83 | |
| AROON (14): | 78.57 | |
| DEMA (21): | 39.65 | |
| Parabolic SAR (0,02-0,02-0,2): | 41.85 | |
| Elder Ray (13): | -1.46 | |
| Super Trend (3,10): | 36.31 | |
| Zig ZAG (10): | 38.41 | |
| VORTEX (21): | 0.9600 | |
| Stochastique (14,3,5): | 52.83 | |
| TEMA (21): | 39.94 | |
| Williams %R (14): | -62.90 | |
| Chande Momentum Oscillator (20): | -1.07 | |
| Repulse (5,40,3): | -1.2600 | |
| ROCnROLL: | 2 | |
| TRIX (15,9): | 0.1400 | |
| Courbe Coppock: | 4.90 |
| MA7: | 39.67 | |
| MA20: | 39.47 | |
| MA50: | 39.31 | |
| MA100: | 41.35 | |
| MAexp7: | 39.40 | |
| MAexp20: | 39.35 | |
| MAexp50: | 39.58 | |
| MAexp100: | 41.59 | |
| Price / MA7: | -3.18% | |
| Price / MA20: | -2.69% | |
| Price / MA50: | -2.29% | |
| Price / MA100: | -7.11% | |
| Price / MAexp7: | -2.51% | |
| Price / MAexp20: | -2.39% | |
| Price / MAexp50: | -2.96% | |
| Price / MAexp100: | -7.65% |
News
Don"t forget to follow the news on HELMERICH & PAYNE INC.. At the time of publication of this analysis, the latest news was as follows:
- Helmerich & Payne, Inc. Announces Fiscal Fourth Quarter 2019 Conference Call and Webcast
- Helmerich & Payne Provides Company Update
- Helmerich & Payne, Inc. Announces First Quarter Results
- Helmerich & Payne, Inc. Invites You to Join Its First Quarter Conference Call on the Web
- Helmerich & Payne, Inc. Announces Fiscal Year-End Results
About author

Online


Add a comment
Comments
0 comments on the analysis HELMERICH & PAYNE INC. - Daily