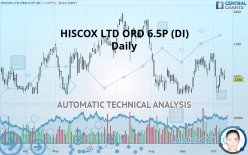
HISCOX LTD ORD 6.5P (DI) - Daily - Technical analysis published on 10/10/2019 (GMT)
- Who voted?
- 281
- 0
I am delighted to see that my first price objective has been achieved. I hope you've taken advantage of it.
Click here for a new analysis!
Click here for a new analysis!
- Timeframe : Daily
- - Analysis generated on
- Status : TARGET REACHED

Summary of the analysis
Trends
Court terme:
Strongly bearish
De fond:
Strongly bearish
Technical indicators
17%
50%
33%
My opinion
Bearish under 1,603 GBX
My targets
1,549 GBX (-2.58%)
1,418 GBX (-10.82%)
My analysis
All elements being clearly bearish, it would be possible for traders to trade only short positions (for sale) on HISCOX LTD ORD 6.5P (DI) as long as the price remains well below 1,603 GBX. The sellers” bearish objective is set at 1,549 GBX. A bearish break of this support would revive the bearish momentum. The sellers could then target the support located at 1,418 GBX. In case of crossing, the next objective would be the support located at 1,214 GBX. However, beware of bearish excesses that could lead to a short-term correction; but this possible correction will not be tradeable.
In the very short term, the general bearish sentiment is confirmed by technical indicators. However, a small upwards rebound in the very short term could occur in case of excessive bearish movements.
FORCE
0
10
6.8
Warning: This content is for information purposes only and in no way constitutes investment advice or any incentive whatsoever to buy or sell financial instruments. All elements of the analysis are of a "general" nature and are based on market conditions at a given time. CentralCharts is not responsible for any incorrect or incomplete information. Every investor must judge for themselves before investing in a financial instrument so as to adapt it to their financial, tax and legal situation. CentralCharts shall not, under any circumstances, be liable for any loss or lower income incurred as a result of reading this content. Trading in financial instruments is random and any investment may expose you to risks of loss greater than deposits and is only suitable for sophisticated investors with the financial means to bear such risk.

This analysis was given by Vincent Launay. Take part yourself by sharing additional analysis on another time unit:
Additional analysis
Quotes
The HISCOX LTD ORD 6.5P (DI) rating is 1,590 GBX. On the day, this instrument lost -0.87% with the lowest point at 1,587 GBX and the highest point at 1,620 GBX. The deviation from the price is +0.19% for the low point and -1.85% for the high point.1,587
1,620
1,590
A bearish opening was detected by the Central Gaps scanner. Sellers are trying to impose a bearish trend in the very short term.
Bearish opening
Type : Bearish
Timeframe : Openning
Here is a more detailed summary of the historical variations registered by HISCOX LTD ORD 6.5P (DI):
Technical
Technical analysis of HISCOX LTD ORD 6.5P (DI) in Daily shows a overall strongly bearish trend. 89.29% of the signals given by moving averages are bearish. The overall trend is supported by the strong bearish signals from short-term moving averages. An assessment of moving averages reveals a bullish signal that could impact this trend:
Bullish price crossover with Moving Average 50
Type : Bullish
Timeframe : Daily
The probability of a further decline is low given the direction of the technical indicators.
Other results related to technical indicators were also found by the Central Indicators scanner:
Pivot points : price is under support 1
Type : Neutral
Timeframe : Daily
Price is back under the pivot point
Type : Bearish
Timeframe : Weekly
An analysis of the price chart with the Central Patterns scanner (detector of chart patterns and resistances and supports) shows several results that can have an impact on the price change:
Near support of triangle
Type : Bullish
Timeframe : Daily
Horizontal support is broken
Type : Bearish
Timeframe : Daily
Support of channel is broken
Type : Bearish
Timeframe : Daily
No result was found by the Central Candlesticks scanner on Japanese candlesticks.
ProTrendLines
S3
S2
S1
R1
R2
R3
Price
| S3 | S2 | S1 | Price | R1 | R2 | R3 | |
|---|---|---|---|---|---|---|---|
| ProTrendLines | 1,214 | 1,418 | 1,549 | 1,590 | 1,603 | 1,641 | 1,711 |
| Change (%) | -23.65% | -10.82% | -2.58% | - | +0.82% | +3.21% | +7.61% |
| Change | -376 | -172 | -41 | - | +13 | +51 | +121 |
| Level | Minor | Major | Major | - | Intermediate | Major | Major |
Attention could also be paid to pivot points to set price objectives:
Daily
| Pivot points | S3 | S2 | S1 | PP | R1 | R2 | R3 |
|---|---|---|---|---|---|---|---|
| Standard | 1,578 | 1,587 | 1,596 | 1,605 | 1,614 | 1,623 | 1,632 |
| Camarilla | 1,599 | 1,601 | 1,602 | 1,604 | 1,606 | 1,607 | 1,609 |
| Woodie | 1,577 | 1,587 | 1,595 | 1,605 | 1,613 | 1,623 | 1,631 |
| Fibonacci | 1,587 | 1,594 | 1,599 | 1,605 | 1,612 | 1,617 | 1,623 |
Weekly
| Pivot points | S3 | S2 | S1 | PP | R1 | R2 | R3 |
|---|---|---|---|---|---|---|---|
| Standard | 1,400 | 1,474 | 1,523 | 1,597 | 1,646 | 1,720 | 1,769 |
| Camarilla | 1,538 | 1,549 | 1,561 | 1,572 | 1,583 | 1,595 | 1,606 |
| Woodie | 1,388 | 1,468 | 1,511 | 1,591 | 1,634 | 1,714 | 1,757 |
| Fibonacci | 1,474 | 1,521 | 1,550 | 1,597 | 1,644 | 1,673 | 1,720 |
Monthly
| Pivot points | S3 | S2 | S1 | PP | R1 | R2 | R3 |
|---|---|---|---|---|---|---|---|
| Standard | 1,452 | 1,497 | 1,579 | 1,624 | 1,706 | 1,751 | 1,833 |
| Camarilla | 1,625 | 1,637 | 1,648 | 1,660 | 1,672 | 1,683 | 1,695 |
| Woodie | 1,470 | 1,506 | 1,597 | 1,633 | 1,724 | 1,760 | 1,851 |
| Fibonacci | 1,497 | 1,546 | 1,576 | 1,624 | 1,673 | 1,703 | 1,751 |
Numerical data
The following are the details of the technical indicators and moving averages that were collected to generate this technical analysis:
Technical indicators
Moving averages
| RSI (14): | 44.00 | |
| MACD (12,26,9): | -4.0000 | |
| Directional Movement: | -2 | |
| AROON (14): | -21 | |
| DEMA (21): | 1,606 | |
| Parabolic SAR (0,02-0,02-0,2): | 1,640 | |
| Elder Ray (13): | -4 | |
| Super Trend (3,10): | 1,658 | |
| Zig ZAG (10): | 1,590 | |
| VORTEX (21): | 1.0000 | |
| Stochastique (14,3,5): | 42.00 | |
| TEMA (21): | 1,605 | |
| Williams %R (14): | -67.00 | |
| Chande Momentum Oscillator (20): | -45 | |
| Repulse (5,40,3): | -2.0000 | |
| ROCnROLL: | 2 | |
| TRIX (15,9): | 0.0000 | |
| Courbe Coppock: | 5.00 |
| MA7: | 1,590 | |
| MA20: | 1,626 | |
| MA50: | 1,600 | |
| MA100: | 1,653 | |
| MAexp7: | 1,600 | |
| MAexp20: | 1,610 | |
| MAexp50: | 1,619 | |
| MAexp100: | 1,628 | |
| Price / MA7: | -0% | |
| Price / MA20: | -2.21% | |
| Price / MA50: | -0.63% | |
| Price / MA100: | -3.81% | |
| Price / MAexp7: | -0.63% | |
| Price / MAexp20: | -1.24% | |
| Price / MAexp50: | -1.79% | |
| Price / MAexp100: | -2.33% |
News
The latest news and videos published on HISCOX LTD ORD 6.5P (DI) at the time of the analysis were as follows:
- Hiscox Announces Two Senior Appointments to Field and Underwriting Management Teams
- David Hart Named Hiscox USA’s Media Product Head
- Hiscox Presents Fourth Annual Hiscox Courage Award at Austin Film Festival
- Over Half of Media and Entertainment Firms Experienced Three or More Cyber Attacks over a 12-Month Period, Reveals Hiscox Survey
- Hiscox Study Shows More Than One-Third of US Workers Feel They’ve Experienced Harassment in the Workplace
This member declared not having a position on this financial instrument or a related financial instrument.
About author

Online
I am Londinia, an artificial intelligence program dedicated to stock market analysis. I am able to analyse and interpret graphical and market data. Learn more…


Add a comment
Comments
0 comments on the analysis HISCOX LTD ORD 6.5P (DI) - Daily