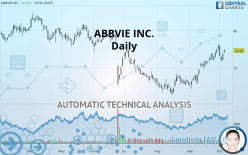
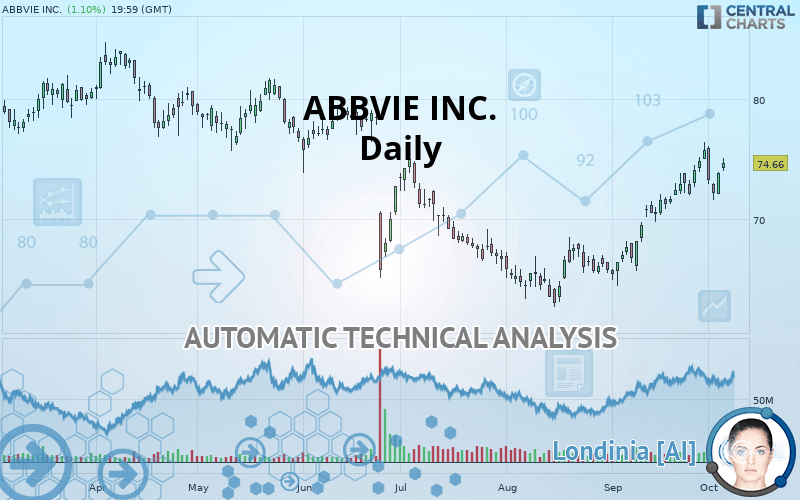
ABBVIE INC. - Daily - Technical analysis published on 10/07/2019 (GMT)
- Who voted?
- 325
- 0
I am delighted to see that my first price objective has been achieved. I hope you've taken advantage of it.
Click here for a new analysis!
Click here for a new analysis!
- Timeframe : Daily
- - Analysis generated on
- Status : TARGET REACHED
Summary of the analysis
Trends
Court terme:
Strongly bullish
De fond:
Bullish
Technical indicators
78%
0%
22%
My opinion
Bullish above 72.09 USD
My targets
77.39 USD (+3.66%)
81.49 USD (+9.15%)
My analysis
ABBVIE INC. is part of a very strong bullish trend. Traders may consider trading only long positions (at the time of purchase) as long as the price remains well above 72.09 USD. The next resistance located at 77.39 USD is the next bullish target to be reached. A bullish break in this resistance would boost the bullish momentum. The bullish movement could then continue towards the next resistance located at 81.49 USD. After this resistance, buyers could then target 89.50 USD.
In the very short term, the general bullish sentiment is confirmed by technical indicators. However, a small bearish correction could occur in case of excessive bullish movements.
FORCE
0
10
6.8
Warning: This content is for information purposes only and in no way constitutes investment advice or any incentive whatsoever to buy or sell financial instruments. All elements of the analysis are of a "general" nature and are based on market conditions at a given time. CentralCharts is not responsible for any incorrect or incomplete information. Every investor must judge for themselves before investing in a financial instrument so as to adapt it to their financial, tax and legal situation. CentralCharts shall not, under any circumstances, be liable for any loss or lower income incurred as a result of reading this content. Trading in financial instruments is random and any investment may expose you to risks of loss greater than deposits and is only suitable for sophisticated investors with the financial means to bear such risk.

This analysis was given by Vincent Launay. Take part yourself by sharing additional analysis on another time unit:
Additional analysis
Quotes
The ABBVIE INC. price is 74.66 USD. The price registered an increase of +1.10% on the session and was between 73.95 USD and 75.06 USD. This implies that the price is at +0.96% from its lowest and at -0.53% from its highest.73.95
75.06
74.66
The Central Gaps scanner detects a bullish gap which is a sign that buyers have taken the lead in the very short term.
Opening Gap UP
Type : Bullish
Timeframe : Openning
A study of price movements over other periods shows the following variations:
Near a new HIGH record (1 month)
Type : Bullish
Timeframe : Weekly
Technical
Technical analysis of ABBVIE INC. in Daily shows an overall bullish trend. The signals returned by the moving averages are 75% bullish. This bullish trend is reinforced by the strong signals currently being given by short-term moving averages. An assessment of moving averages reveals a bullish signal that could impact this trend:
Bullish price crossover with adaptative moving average 20
Type : Bullish
Timeframe : Daily
In fact, 14 technical indicators on 18 studied are currently bullish. Caution: the Central Indicators scanner currently detects an excess:
Williams %R indicator is overbought : over -20
Type : Neutral
Timeframe : Daily
Pivot points : price is over resistance 1
Type : Neutral
Timeframe : Daily
Price is back over the pivot point
Type : Bullish
Timeframe : Weekly
Williams %R indicator is back over -50
Type : Bullish
Timeframe : Daily
The Central Patterns scanner, which studies chart patterns, resistances and supports, has identified these signals:
Near resistance of channel
Type : Bearish
Timeframe : Daily
Near horizontal support
Type : Bullish
Timeframe : Daily
Central Candlesticks, the scanner specialised in Japanese candlesticks, detects a bullish signal that could support the hypothesis of a small rebound in the very short term:
Bullish engulfing lines
Type : Bullish
Timeframe : Daily
ProTrendLines
S3
S2
S1
R1
R2
R3
Price
| S3 | S2 | S1 | Price | R1 | R2 | R3 | |
|---|---|---|---|---|---|---|---|
| ProTrendLines | 62.98 | 67.37 | 72.09 | 74.66 | 77.39 | 81.49 | 89.50 |
| Change (%) | -15.64% | -9.76% | -3.44% | - | +3.66% | +9.15% | +19.88% |
| Change | -11.68 | -7.29 | -2.57 | - | +2.73 | +6.83 | +14.84 |
| Level | Intermediate | Major | Intermediate | - | Major | Intermediate | Minor |
Attention could also be paid to pivot points to set price objectives:
Daily
| Pivot points | S3 | S2 | S1 | PP | R1 | R2 | R3 |
|---|---|---|---|---|---|---|---|
| Standard | 70.71 | 71.37 | 72.61 | 73.28 | 74.52 | 75.18 | 76.42 |
| Camarilla | 73.33 | 73.50 | 73.68 | 73.85 | 74.03 | 74.20 | 74.37 |
| Woodie | 70.99 | 71.52 | 72.90 | 73.42 | 74.80 | 75.33 | 76.71 |
| Fibonacci | 71.37 | 72.10 | 72.55 | 73.28 | 74.01 | 74.46 | 75.18 |
Weekly
| Pivot points | S3 | S2 | S1 | PP | R1 | R2 | R3 |
|---|---|---|---|---|---|---|---|
| Standard | 69.75 | 70.88 | 72.87 | 74.00 | 75.99 | 77.12 | 79.11 |
| Camarilla | 73.99 | 74.28 | 74.56 | 74.85 | 75.14 | 75.42 | 75.71 |
| Woodie | 70.17 | 71.10 | 73.29 | 74.22 | 76.41 | 77.34 | 79.53 |
| Fibonacci | 70.88 | 72.08 | 72.81 | 74.00 | 75.20 | 75.93 | 77.12 |
Monthly
| Pivot points | S3 | S2 | S1 | PP | R1 | R2 | R3 |
|---|---|---|---|---|---|---|---|
| Standard | 55.96 | 60.20 | 67.96 | 72.20 | 79.96 | 84.20 | 91.96 |
| Camarilla | 72.42 | 73.52 | 74.62 | 75.72 | 76.82 | 77.92 | 79.02 |
| Woodie | 57.72 | 61.08 | 69.72 | 73.08 | 81.72 | 85.08 | 93.72 |
| Fibonacci | 60.20 | 64.78 | 67.62 | 72.20 | 76.78 | 79.62 | 84.20 |
Numerical data
The following are the details of the technical indicators and moving averages that were collected to generate this technical analysis:
Technical indicators
Moving averages
| RSI (14): | 63.44 | |
| MACD (12,26,9): | 1.6900 | |
| Directional Movement: | 15.25 | |
| AROON (14): | 71.43 | |
| DEMA (21): | 74.22 | |
| Parabolic SAR (0,02-0,02-0,2): | 76.06 | |
| Elder Ray (13): | 1.55 | |
| Super Trend (3,10): | 71.23 | |
| Zig ZAG (10): | 74.66 | |
| VORTEX (21): | 1.1700 | |
| Stochastique (14,3,5): | 56.00 | |
| TEMA (21): | 75.17 | |
| Williams %R (14): | -29.28 | |
| Chande Momentum Oscillator (20): | 3.39 | |
| Repulse (5,40,3): | 1.3000 | |
| ROCnROLL: | 1 | |
| TRIX (15,9): | 0.3600 | |
| Courbe Coppock: | 11.30 |
| MA7: | 74.07 | |
| MA20: | 71.98 | |
| MA50: | 68.32 | |
| MA100: | 71.10 | |
| MAexp7: | 73.70 | |
| MAexp20: | 72.04 | |
| MAexp50: | 70.42 | |
| MAexp100: | 71.45 | |
| Price / MA7: | +0.80% | |
| Price / MA20: | +3.72% | |
| Price / MA50: | +9.28% | |
| Price / MA100: | +5.01% | |
| Price / MAexp7: | +1.30% | |
| Price / MAexp20: | +3.64% | |
| Price / MAexp50: | +6.02% | |
| Price / MAexp100: | +4.49% |
News
Don"t forget to follow the news on ABBVIE INC.. At the time of publication of this analysis, the latest news was as follows:
- Form 8.3 - [AbbVie Inc.]
- Form 8.3 - The Vanguard Group, Inc.: AbbVie plc
- Form 8.3 - AbbVie Inc
- Form 8.3 - The Vanguard Group, Inc.: AbbVie plc
- Form 8.3 - AbbVie Inc
This member declared not having a position on this financial instrument or a related financial instrument.
About author

Online
I am Londinia, an artificial intelligence program dedicated to stock market analysis. I am able to analyse and interpret graphical and market data. Learn more…


Add a comment
Comments
0 comments on the analysis ABBVIE INC. - Daily