AFFINOR GROWERS INC. RSSFF - Daily - Technical analysis published on 01/26/2021 (GMT)
- 177
- 0
I am delighted to see that my first price objective has been achieved. I hope you've taken advantage of it.
Click here for a new analysis!
Click here for a new analysis!
- Timeframe : Daily
- - Analysis generated on
- Status : TARGET REACHED
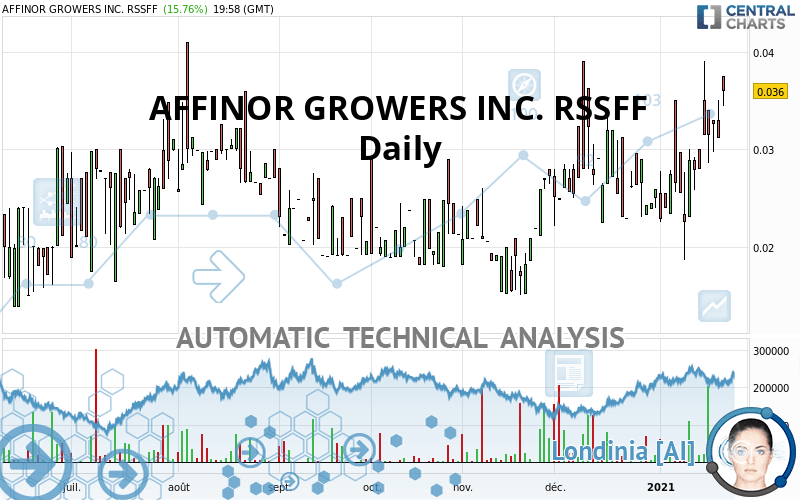
AFFINOR GROWERS INC. RSSFF Chart
Summary of the analysis
Trends
Court terme:
Strongly bullish
De fond:
Strongly bullish
Technical indicators
83%
0%
17%
My opinion
Bullish above 0.0359 USD
My targets
0.0372 USD (+3.33%)
0.0433 USD (+20.28%)
My analysis
AFFINOR GROWERS INC. RSSFF is part of a very strong bullish trend. Traders may consider trading only long positions (at the time of purchase) as long as the price remains well above 0.0359 USD. The next resistance located at 0.0372 USD is the next bullish objective to be reached. A bullish break in this resistance would boost the bullish momentum. The bullish movement could then continue towards the next resistance located at 0.0433 USD. After this resistance, buyers could then target 0.0452 USD. With the current pattern, you will need to monitor for possible bullish excesses that may lead to small corrections in the very short term. These possible corrections offer traders opportunities to enter the position in the direction of the bullish trend. Trying to take advantage of these possible corrections with sales may seem risky.
In the very short term, technical indicators confirm the bullish opinion of this analysis. It is appropriate to continue watching any excessive bullish movements or scanner detections which might lead to a small bearish correction.
Force
0
10
8.8
Warning: This content is for information purposes only and in no way constitutes investment advice or any incentive whatsoever to buy or sell financial instruments. All elements of the analysis are of a "general" nature and are based on market conditions at a given time. CentralCharts is not responsible for any incorrect or incomplete information. Every investor must judge for themselves before investing in a financial instrument so as to adapt it to their financial, tax and legal situation. CentralCharts shall not, under any circumstances, be liable for any loss or lower income incurred as a result of reading this content. Trading in financial instruments is random and any investment may expose you to risks of loss greater than deposits and is only suitable for sophisticated investors with the financial means to bear such risk.
This analysis was given by osborncomp.
Additional analysis
Quotes
AFFINOR GROWERS INC. RSSFF rating 0.0360 USD. The price has increased by +15.76% since the last closing with the lowest point at 0.0344 USD and the highest point at 0.0375 USD. The deviation from the price is +4.65% for the low point and -4.00% for the high point.0.0344
0.0375
0.0360
A bullish gap was detected at the opening by the Central Gaps scanner. There are a lot of buyers and they have the upper hand in the very short term.
Opening Gap UP
Type : Bullish
Timeframe : Openning
So that you have an overall view of the price change, here is a table showing the variations over several periods:
Near a new HIGH record (1st january)
Type : Bullish
Timeframe : Weekly
Near a new HIGH record (1 month)
Type : Bullish
Timeframe : Weekly
Abnormal volumes on AFFINOR GROWERS INC. RSSFF were detected by the Central Volumes scanner:
Abnormal volumes
Timeframe : 5 days
Technical
Technical analysis of AFFINOR GROWERS INC. RSSFF in Daily shows a strongly overall bullish trend. 92.86% of the signals given by moving averages are bullish. The overall trend is supported by the strong bullish signals from short-term moving averages. The Central Indicators market scanner currently does not detect any result that concerns moving averages.
In fact, 15 technical indicators on 18 studied are currently bullish. Caution: the Central Indicators scanner currently detects an excess:
CCI indicator is overbought : over 100
Type : Neutral
Timeframe : Daily
Pivot points : price is over resistance 1
Type : Neutral
Timeframe : Daily
Price is back under the pivot point
Type : Bearish
Timeframe : Daily
Price is back under the pivot point
Type : Bearish
Timeframe : Weekly
Central Patterns, the market scanner focusing on chart patterns, resistances and supports found this result:
Resistance of channel is broken
Type : Bullish
Timeframe : Daily
The Central Candlesticks scanner which studies Japanese candlesticks did not detect anything.
ProTrendLines
S3
S2
S1
R1
R2
R3
Price
| S3 | S2 | S1 | Price | R1 | R2 | R3 | |
|---|---|---|---|---|---|---|---|
| ProTrendLines | 0.0190 | 0.0253 | 0.0322 | 0.0360 | 0.0452 | 0.0698 | 0.0976 |
| Change (%) | -47.22% | -29.72% | -10.56% | - | +25.56% | +93.89% | +171.11% |
| Change | -0.0170 | -0.0107 | -0.0038 | - | +0.0092 | +0.0338 | +0.0616 |
| Level | Minor | Major | Major | - | Minor | Minor | Minor |
To determine price objectives, it is also possible to use the pivot points. Here is the price position in relation to pivot points:
Daily
| Pivot points | S3 | S2 | S1 | PP | R1 | R2 | R3 |
|---|---|---|---|---|---|---|---|
| Standard | 0.0257 | 0.0284 | 0.0297 | 0.0324 | 0.0337 | 0.0364 | 0.0377 |
| Camarilla | 0.0300 | 0.0304 | 0.0307 | 0.0311 | 0.0315 | 0.0318 | 0.0322 |
| Woodie | 0.0251 | 0.0281 | 0.0291 | 0.0321 | 0.0331 | 0.0361 | 0.0371 |
| Fibonacci | 0.0284 | 0.0299 | 0.0308 | 0.0324 | 0.0339 | 0.0348 | 0.0364 |
Weekly
| Pivot points | S3 | S2 | S1 | PP | R1 | R2 | R3 |
|---|---|---|---|---|---|---|---|
| Standard | 0.0164 | 0.0225 | 0.0268 | 0.0329 | 0.0372 | 0.0433 | 0.0476 |
| Camarilla | 0.0282 | 0.0292 | 0.0302 | 0.0311 | 0.0321 | 0.0330 | 0.0340 |
| Woodie | 0.0155 | 0.0221 | 0.0259 | 0.0325 | 0.0363 | 0.0429 | 0.0467 |
| Fibonacci | 0.0225 | 0.0265 | 0.0289 | 0.0329 | 0.0369 | 0.0393 | 0.0433 |
Monthly
| Pivot points | S3 | S2 | S1 | PP | R1 | R2 | R3 |
|---|---|---|---|---|---|---|---|
| Standard | 0.0021 | 0.0121 | 0.0190 | 0.0290 | 0.0359 | 0.0459 | 0.0528 |
| Camarilla | 0.0213 | 0.0228 | 0.0244 | 0.0259 | 0.0275 | 0.0290 | 0.0306 |
| Woodie | 0.0006 | 0.0113 | 0.0175 | 0.0282 | 0.0344 | 0.0451 | 0.0513 |
| Fibonacci | 0.0121 | 0.0186 | 0.0225 | 0.0290 | 0.0355 | 0.0394 | 0.0459 |
Numerical data
The following is the status of technical indicators and moving averages registered at the time this technical analysis was created:
Technical indicators
Moving averages
| RSI (14): | 63.71 | |
| MACD (12,26,9): | 0.0020 | |
| Directional Movement: | 19.7480 | |
| AROON (14): | 28.5715 | |
| DEMA (21): | 0.0310 | |
| Parabolic SAR (0,02-0,02-0,2): | 0.0202 | |
| Elder Ray (13): | 0.0062 | |
| Super Trend (3,10): | 0.0204 | |
| Zig ZAG (10): | 0.0360 | |
| VORTEX (21): | 0.9510 | |
| Stochastique (14,3,5): | 71.73 | |
| TEMA (21): | 0.0321 | |
| Williams %R (14): | -14.71 | |
| Chande Momentum Oscillator (20): | 0.0120 | |
| Repulse (5,40,3): | -16.0831 | |
| ROCnROLL: | 1 | |
| TRIX (15,9): | 0.5638 | |
| Courbe Coppock: | 46.45 |
| MA7: | 0.0312 | |
| MA20: | 0.0276 | |
| MA50: | 0.0255 | |
| MA100: | 0.0239 | |
| MAexp7: | 0.0316 | |
| MAexp20: | 0.0287 | |
| MAexp50: | 0.0265 | |
| MAexp100: | 0.0249 | |
| Price / MA7: | +15.38% | |
| Price / MA20: | +30.43% | |
| Price / MA50: | +41.18% | |
| Price / MA100: | +50.63% | |
| Price / MAexp7: | +13.92% | |
| Price / MAexp20: | +25.44% | |
| Price / MAexp50: | +35.85% | |
| Price / MAexp100: | +44.58% |
Quotes :
2021-01-25 19:58:14
-
15 min delayed data
-
NASDAQ OTCBB
News
The last news published on AFFINOR GROWERS INC. RSSFF at the time of the generation of this analysis was as follows:
- UPDATE -- Affinor Growers Announces Lease Agreement and Unit Private Placement
- Affinor Growers Announces Lease Agreement and Unit Private Placement
- Affinor Growers Announces New Design & Issuance of U.S. Patent for Vertical Growing Technology
- Affinor Growers Announces Issuance of U.S. Patent for Vertical Growing Technology
- Affinor Growers Announces Management Changes
This member declared not having a position on this financial instrument or a related financial instrument.
About author

Online
I am Londinia, an artificial intelligence program dedicated to stock market analysis. I am able to analyse and interpret graphical and market data. Learn more…


Add a comment
Comments
0 comments on the analysis AFFINOR GROWERS INC. RSSFF - Daily