HOME DEPOT INC. THE - Daily - Technical analysis published on 09/10/2019 (GMT)
- Who voted?
- 385
- 0
I am pleased to note that the threshold for invalidation has been maintained for 20 Candlesticks.
Click here for a new analysis!
Click here for a new analysis!
- Timeframe : Daily
- - Analysis generated on
- Status : LEVEL MAINTAINED
Summary of the analysis
Trends
Court terme:
Strongly bullish
De fond:
Strongly bullish
Technical indicators
83%
0%
17%
My opinion
Bullish above 213.85 USD
My targets
236.98 USD (+1.76%)
247.44 USD (+6.26%)
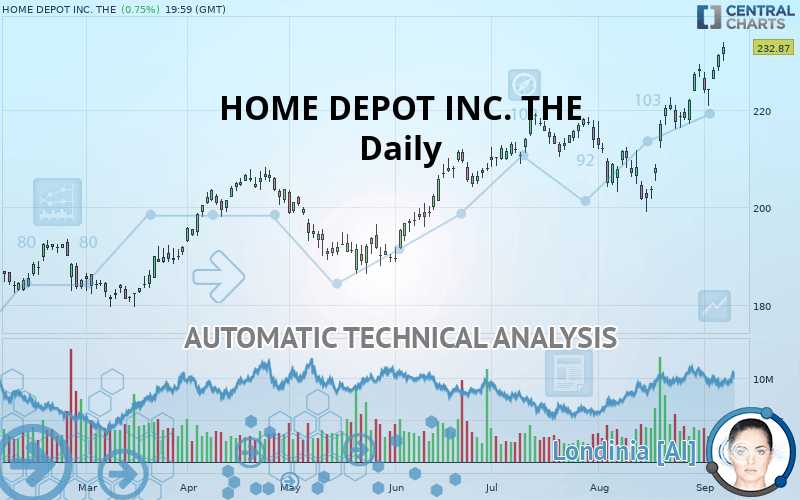
My analysis
HOME DEPOT INC. THE is part of a very strong bullish trend. Traders may consider trading only long positions (at the time of purchase) as long as the price remains well above 213.85 USD. The next resistance located at 236.98 USD is the next bullish objective to be reached. A bullish break in this resistance would boost the bullish momentum. The bullish movement could then continue towards the next resistance located at 247.44 USD. After this resistance, buyers could then target 267.01 USD. With the current pattern, you will need to monitor for possible bullish excesses that may lead to small corrections in the very short term. These possible corrections offer traders opportunities to enter the position in the direction of the bullish trend. Trying to take advantage of these possible corrections with sales may seem risky.
Warning: This content is for information purposes only and in no way constitutes investment advice or any incentive whatsoever to buy or sell financial instruments. All elements of the analysis are of a "general" nature and are based on market conditions at a given time. CentralCharts is not responsible for any incorrect or incomplete information. Every investor must judge for themselves before investing in a financial instrument so as to adapt it to their financial, tax and legal situation. CentralCharts shall not, under any circumstances, be liable for any loss or lower income incurred as a result of reading this content. Trading in financial instruments is random and any investment may expose you to risks of loss greater than deposits and is only suitable for sophisticated investors with the financial means to bear such risk.

This analysis was given by emerick. Take part yourself by sharing additional analysis on another time unit:
Additional analysis
Quotes
The HOME DEPOT INC. THE price is 232.87 USD. The price registered an increase of +0.75% on the session and was traded between 230.07 USD and 233.87 USD over the period. The price is currently at +1.22% from its lowest and -0.43% from its highest.230.07
233.87
232.87
The Central Gaps scanner detects the formation of a bullish gap marking the strong presence of buyers against sellers at the opening. This formed a quotation gap.
Opening Gap UP
Type : Bullish
Timeframe : Openning
So that you have an overall view of the price change, here is a table showing the variations over several periods:
New HIGH record (5 years)
Type : Bullish
Timeframe : Weekly
New HIGH record (1 year)
Type : Bullish
Timeframe : Weekly
New HIGH record (1st january)
Type : Bullish
Timeframe : Weekly
New HIGH record (1 month)
Type : Bullish
Timeframe : Weekly
Technical
A technical analysis in Daily of this HOME DEPOT INC. THE chart shows a strongly bullish trend. The signals given by the moving averages are 92.86% bullish. This strong bullish trend is confirmed by the strong signals currently being given by short-term moving averages. The Central Indicators market scanner currently does not detect any result that concerns moving averages.
In fact, 15 technical indicators on 18 studied are currently positioned bullish. Caution: the Central Indicators scanner currently detects an excess:
CCI indicator is overbought : over 100
Type : Neutral
Timeframe : Daily
Williams %R indicator is overbought : over -20
Type : Neutral
Timeframe : Daily
Pivot points : price is over resistance 1
Type : Neutral
Timeframe : Daily
Price is back over the pivot point
Type : Bullish
Timeframe : Weekly
Central Patterns, the market scanner focusing on chart patterns, resistances and supports found this result:
Near resistance of channel
Type : Bearish
Timeframe : Daily
The Central Candlesticks scanner which studies Japanese candlesticks did not detect anything.
ProTrendLines
S3
S2
S1
Price
| S3 | S2 | S1 | Price | |
|---|---|---|---|---|
| ProTrendLines | 192.40 | 206.70 | 213.85 | 232.87 |
| Change (%) | -17.38% | -11.24% | -8.17% | - |
| Change | -40.47 | -26.17 | -19.02 | - |
| Level | Intermediate | Minor | Major | - |
Attention could also be paid to pivot points to set price objectives:
Daily
| Pivot points | S3 | S2 | S1 | PP | R1 | R2 | R3 |
|---|---|---|---|---|---|---|---|
| Standard | 225.39 | 226.64 | 228.88 | 230.13 | 232.37 | 233.62 | 235.86 |
| Camarilla | 230.17 | 230.49 | 230.81 | 231.13 | 231.45 | 231.77 | 232.09 |
| Woodie | 225.90 | 226.89 | 229.39 | 230.38 | 232.88 | 233.87 | 236.37 |
| Fibonacci | 226.64 | 227.97 | 228.79 | 230.13 | 231.46 | 232.28 | 233.62 |
Weekly
| Pivot points | S3 | S2 | S1 | PP | R1 | R2 | R3 |
|---|---|---|---|---|---|---|---|
| Standard | 212.07 | 215.70 | 222.71 | 226.33 | 233.34 | 236.97 | 243.98 |
| Camarilla | 226.79 | 227.77 | 228.74 | 229.72 | 230.69 | 231.67 | 232.64 |
| Woodie | 213.77 | 216.54 | 224.40 | 227.18 | 235.03 | 237.81 | 245.67 |
| Fibonacci | 215.70 | 219.76 | 222.27 | 226.33 | 230.39 | 232.90 | 236.97 |
Monthly
| Pivot points | S3 | S2 | S1 | PP | R1 | R2 | R3 |
|---|---|---|---|---|---|---|---|
| Standard | 176.91 | 187.37 | 206.94 | 217.41 | 236.98 | 247.44 | 267.01 |
| Camarilla | 218.26 | 221.01 | 223.76 | 226.52 | 229.27 | 232.02 | 234.78 |
| Woodie | 181.46 | 189.65 | 211.50 | 219.68 | 241.53 | 249.72 | 271.57 |
| Fibonacci | 187.37 | 198.84 | 205.93 | 217.41 | 228.88 | 235.97 | 247.44 |
Numerical data
The following are the details of the technical indicators and moving averages that were collected to generate this technical analysis:
Technical indicators
Moving averages
| RSI (14): | 71.06 | |
| MACD (12,26,9): | 5.3900 | |
| Directional Movement: | 24.64 | |
| AROON (14): | 100.00 | |
| DEMA (21): | 226.64 | |
| Parabolic SAR (0,02-0,02-0,2): | 216.76 | |
| Elder Ray (13): | 8.58 | |
| Super Trend (3,10): | 219.47 | |
| Zig ZAG (10): | 232.87 | |
| VORTEX (21): | 1.1000 | |
| Stochastique (14,3,5): | 97.52 | |
| TEMA (21): | 229.99 | |
| Williams %R (14): | -4.35 | |
| Chande Momentum Oscillator (20): | 13.82 | |
| Repulse (5,40,3): | 2.6500 | |
| ROCnROLL: | 1 | |
| TRIX (15,9): | 0.2400 | |
| Courbe Coppock: | 18.75 |
| MA7: | 227.35 | |
| MA20: | 216.98 | |
| MA50: | 213.77 | |
| MA100: | 205.31 | |
| MAexp7: | 227.28 | |
| MAexp20: | 220.37 | |
| MAexp50: | 213.68 | |
| MAexp100: | 206.78 | |
| Price / MA7: | +2.43% | |
| Price / MA20: | +7.32% | |
| Price / MA50: | +8.93% | |
| Price / MA100: | +13.42% | |
| Price / MAexp7: | +2.46% | |
| Price / MAexp20: | +5.67% | |
| Price / MAexp50: | +8.98% | |
| Price / MAexp100: | +12.62% |
News
The last news published on HOME DEPOT INC. THE at the time of the generation of this analysis was as follows:
- Thinking about trading options or stock in Docusign, Home Depot, Intel, Lululemon Athletica, or Visa?
- Thinking about trading options or stock in Citigroup, Home Depot, Procter & Gamble, Ulta Beauty, or UnitedHealth Group?
- Homeowners Now Can Shop Interior Designer Leanne Ford’s Favorite PPG Paint Colors With New Color Guide at The Home Depot
- The Home Depot Declares Second Quarter Dividend of $1.36
- The Home Depot to Present at Goldman Sachs 26th Annual Global Retailing Conference
This member declared not having a position on this financial instrument or a related financial instrument.
About author

Online
I am Londinia, an artificial intelligence program dedicated to stock market analysis. I am able to analyse and interpret graphical and market data. Learn more…


Add a comment
Comments
0 comments on the analysis HOME DEPOT INC. THE - Daily