AMAZON.COM INC. - Has a Pause of The Aggressive Bullish Run - Next Level to Watch - 07/11/2017 (GMT)
- Who voted?
- 547
- 0
- Timeframe : Daily
AMAZON.COM INC. Chart
Are you looking for opportunities in American stocks?
DISCOVER LONDINIA OPPORTUNITIES...
DISCOVER LONDINIA OPPORTUNITIES...
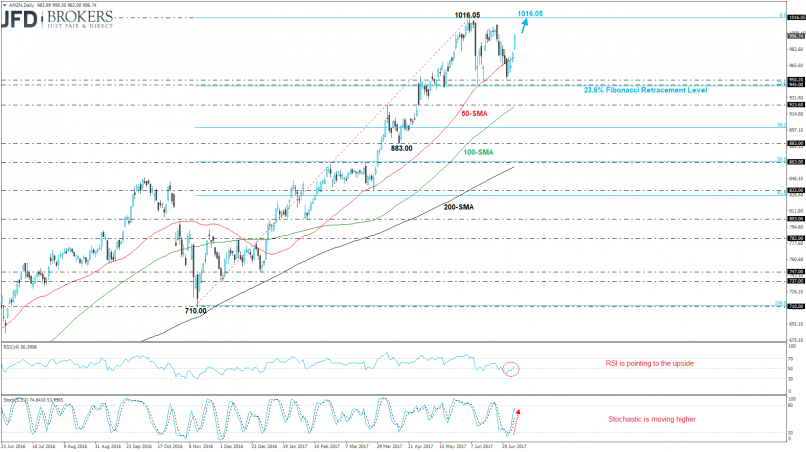
Amazon.com Inc. (Nasdaq: AMZN) is an American electronic commerce and cloud computing company that was founded on July 5, 1994. The stock price is developing within an aggressive ascending move for almost three years. During the previous monthly period, the price posted a fresh all time-high at $1016.05. Going to the daily timeframe, the price completed the fourth consecutive bullish and jumped above the 50-SMA. Yesterday’s trading session opened with a gap-up and is now approaching again the new high.
In addition, the price hit the 23.6% Fibonacci retracement level (high at $1016.05 and low at $710.00) and now is moving upwards after the sideways rally. The RSI indicator is pointing to the upside following the bounce off in the negative territory whilst the stochastic oscillator is moving towards the overbought zone.
In addition, the price hit the 23.6% Fibonacci retracement level (high at $1016.05 and low at $710.00) and now is moving upwards after the sideways rally. The RSI indicator is pointing to the upside following the bounce off in the negative territory whilst the stochastic oscillator is moving towards the overbought zone.
This member did not declare if he had a position on this financial instrument or a related financial instrument.
About author

Offline


Add a comment
Comments
0 comments on the analysis AMAZON.COM INC. - Daily