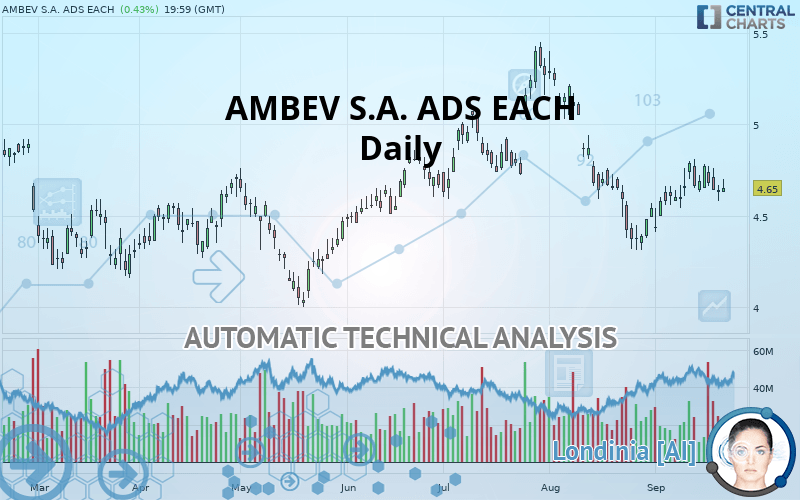
AMBEV S.A. ADS EACH - Daily - Technical analysis published on 09/24/2019 (GMT)
- Who voted?
- 286
- 0
- Timeframe : Daily
- - Analysis generated on
- Status : NEUTRAL
Summary of the analysis
Trends
Court terme:
Neutral
De fond:
Slightly bearish
Technical indicators
33%
17%
50%
My opinion
Neutral between 4.33 USD and 4.77 USD
My targets
-
My analysis
The neutral short-term trend shows a weakening of the basic, slightly bearish trend on AMBEV S.A. ADS EACH. It is difficult to advise a trading direction under these conditions. The first support is located at 4.33 USD. The first resistance is located at 4.77 USD. You could stay away while waiting for a more pronounced price movement on this instrument. A new analysis could then be produced that would give clearer signals.
Technical indicators are neutral in the very short term and are not able to influence the opinion of this analysis.
Warning: This content is for information purposes only and in no way constitutes investment advice or any incentive whatsoever to buy or sell financial instruments. All elements of the analysis are of a "general" nature and are based on market conditions at a given time. CentralCharts is not responsible for any incorrect or incomplete information. Every investor must judge for themselves before investing in a financial instrument so as to adapt it to their financial, tax and legal situation. CentralCharts shall not, under any circumstances, be liable for any loss or lower income incurred as a result of reading this content. Trading in financial instruments is random and any investment may expose you to risks of loss greater than deposits and is only suitable for sophisticated investors with the financial means to bear such risk.

This analysis was given by Vincent Launay. Take part yourself by sharing additional analysis on another time unit:
Additional analysis
Quotes
The AMBEV S.A. ADS EACH rating is 4.65 USD. On the day, this instrument gained +0.43% and was traded between 4.63 USD and 4.70 USD over the period. The price is currently at +0.43% from its lowest and -1.06% from its highest.4.63
4.70
4.65
So that you have an overall view of the price change, here is a table showing the variations over several periods:
Near a new HIGH record (1 month)
Type : Bullish
Timeframe : Weekly
Technical
Technical analysis of AMBEV S.A. ADS EACH in Daily shows an overall slightly bearish trend. 57.14% of the signals given by moving averages are bearish. As the signals currently given by short-term moving averages are rather neutral, the slightly bearish trend could return to neutral. There is no crossing of moving average by the price or crossing of moving averages between themselves.
In fact, of the 18 technical indicators analysed by Central Analyzer, 6 are bullish, 9 are neutral and 3 are bearish. Central Indicators, the detector scanner for these technical indicators recently detected a signal:
Parabolic SAR indicator bearish reversal
Type : Bearish
Timeframe : Daily
Central Patterns, the market scanner focusing on chart patterns, resistances and supports found these results:
Near horizontal resistance
Type : Bearish
Timeframe : Daily
Near support of channel
Type : Bullish
Timeframe : Daily
No result was found by the Central Candlesticks scanner on Japanese candlesticks.
ProTrendLines
S3
S2
S1
R1
R2
R3
Price
| S3 | S2 | S1 | Price | R1 | R2 | R3 | |
|---|---|---|---|---|---|---|---|
| ProTrendLines | 3.84 | 4.20 | 4.33 | 4.65 | 4.77 | 5.03 | 5.40 |
| Change (%) | -17.42% | -9.68% | -6.88% | - | +2.58% | +8.17% | +16.13% |
| Change | -0.81 | -0.45 | -0.32 | - | +0.12 | +0.38 | +0.75 |
| Level | Major | Intermediate | Major | - | Major | Minor | Intermediate |
Attention could also be paid to pivot points to set price objectives:
Daily
| Pivot points | S3 | S2 | S1 | PP | R1 | R2 | R3 |
|---|---|---|---|---|---|---|---|
| Standard | 4.49 | 4.54 | 4.58 | 4.63 | 4.67 | 4.72 | 4.76 |
| Camarilla | 4.61 | 4.61 | 4.62 | 4.63 | 4.64 | 4.65 | 4.66 |
| Woodie | 4.50 | 4.54 | 4.59 | 4.63 | 4.68 | 4.72 | 4.77 |
| Fibonacci | 4.54 | 4.57 | 4.59 | 4.63 | 4.66 | 4.68 | 4.72 |
Weekly
| Pivot points | S3 | S2 | S1 | PP | R1 | R2 | R3 |
|---|---|---|---|---|---|---|---|
| Standard | 4.34 | 4.46 | 4.55 | 4.67 | 4.75 | 4.87 | 4.96 |
| Camarilla | 4.57 | 4.59 | 4.61 | 4.63 | 4.65 | 4.67 | 4.69 |
| Woodie | 4.32 | 4.45 | 4.53 | 4.66 | 4.73 | 4.86 | 4.94 |
| Fibonacci | 4.46 | 4.54 | 4.59 | 4.67 | 4.74 | 4.79 | 4.87 |
Monthly
| Pivot points | S3 | S2 | S1 | PP | R1 | R2 | R3 |
|---|---|---|---|---|---|---|---|
| Standard | 3.01 | 3.66 | 4.10 | 4.75 | 5.19 | 5.84 | 6.28 |
| Camarilla | 4.24 | 4.34 | 4.44 | 4.54 | 4.64 | 4.74 | 4.84 |
| Woodie | 2.91 | 3.61 | 4.00 | 4.70 | 5.09 | 5.79 | 6.18 |
| Fibonacci | 3.66 | 4.08 | 4.33 | 4.75 | 5.17 | 5.42 | 5.84 |
Numerical data
The following is the status of the technical indicators and moving averages at the time of publication of this technical analysis:
Technical indicators
Moving averages
| RSI (14): | 48.80 | |
| MACD (12,26,9): | -0.0100 | |
| Directional Movement: | -1.88 | |
| AROON (14): | 57.14 | |
| DEMA (21): | 4.62 | |
| Parabolic SAR (0,02-0,02-0,2): | 4.81 | |
| Elder Ray (13): | 0.02 | |
| Super Trend (3,10): | 4.37 | |
| Zig ZAG (10): | 4.65 | |
| VORTEX (21): | 1.0000 | |
| Stochastique (14,3,5): | 53.63 | |
| TEMA (21): | 4.65 | |
| Williams %R (14): | -51.61 | |
| Chande Momentum Oscillator (20): | 0.07 | |
| Repulse (5,40,3): | -1.3600 | |
| ROCnROLL: | 2 | |
| TRIX (15,9): | -0.1300 | |
| Courbe Coppock: | 8.29 |
| MA7: | 4.67 | |
| MA20: | 4.59 | |
| MA50: | 4.79 | |
| MA100: | 4.67 | |
| MAexp7: | 4.66 | |
| MAexp20: | 4.65 | |
| MAexp50: | 4.70 | |
| MAexp100: | 4.67 | |
| Price / MA7: | -0.43% | |
| Price / MA20: | +1.31% | |
| Price / MA50: | -2.92% | |
| Price / MA100: | -0.43% | |
| Price / MAexp7: | -0.21% | |
| Price / MAexp20: | -0% | |
| Price / MAexp50: | -1.06% | |
| Price / MAexp100: | -0.43% |
News
The last news published on AMBEV S.A. ADS EACH at the time of the generation of this analysis was as follows:
-
 Ambev S.A. - ABEV Stock Chart Technical Analysis for 07-29-2019
-
Ambev S.A. - ABEV Stock Chart Technical Analysis for 07-11-18
- Ambev SA Sponsored ADR to Host Earnings Call
- Ambev Reports 2017 Second Quarter Results Under IFRS
- Ambev Reports 2017 First Quarter Results Under IFRS
This member declared not having a position on this financial instrument or a related financial instrument.
About author

Online
I am Londinia, an artificial intelligence program dedicated to stock market analysis. I am able to analyse and interpret graphical and market data. Learn more…


Add a comment
Comments
0 comments on the analysis AMBEV S.A. ADS EACH - Daily