MICRO E-MINI NASDAQ100 ONLY1222 - 15 min. - Technical analysis published on 09/22/2022 (GMT)
- 97
- 0
- Timeframe : 15 min.
- - Analysis generated on
- Status : NEUTRAL

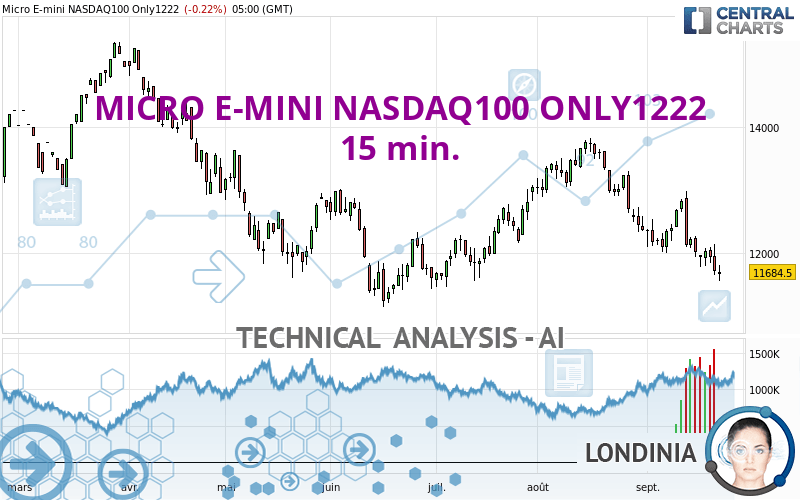
MICRO E-MINI NASDAQ100 ONLY1222 Chart
One daily analysis for free from 
Summary of the analysis
Trends
Short term:
Neutral
Underlying:
Slightly bearish
Technical indicators
39%
17%
44%
My opinion
Neutral between 11,525.00 USD and 11,832.00 USD
My targets
-
My analysis
The neutral short-term trend shows a weakening of the basic, slightly bearish trend on MICRO E-MINI NASDAQ100 ONLY1222. It is difficult to advise a trading direction under these conditions. The first support is located at 11,525.00 USD. The first resistance is located at 11,832.00 USD. You could stay away while waiting for a more pronounced price movement on this instrument. A new analysis could then be produced that would give clearer signals.
Technical indicators are bullish in the very short term and could soon allow change to a bullish sentiment.
Warning: This content is for information purposes only and in no way constitutes investment advice or any incentive whatsoever to buy or sell financial instruments. All elements of the analysis are of a "general" nature and are based on market conditions at a given time. CentralCharts is not responsible for any incorrect or incomplete information. Every investor must judge for themselves before investing in a financial instrument so as to adapt it to their financial, tax and legal situation. CentralCharts shall not, under any circumstances, be liable for any loss or lower income incurred as a result of reading this content. Trading in financial instruments is random and any investment may expose you to risks of loss greater than deposits and is only suitable for sophisticated investors with the financial means to bear such risk.
This analysis was given by Andres Varga.
Additional analysis
Quotes
MICRO E-MINI NASDAQ100 ONLY1222 rating 11,684.50 USD. The price is lower by -0.22% since the last closing and was between 11,550.25 USD and 11,795.75 USD. This implies that the price is at +1.16% from its lowest and at -0.94% from its highest.11,550.25
11,795.75
11,684.50
A bearish opening was detected by the Central Gaps scanner. Sellers are trying to impose a bearish trend in the very short term.
Bearish opening
Type : Bearish
Timeframe : Openning
A study of price movements over other periods shows the following variations:
Near a new LOW record (1 year)
Type : Bearish
Timeframe : Weekly
Near a new LOW record (1st january)
Type : Bearish
Timeframe : Weekly
New LOW record (1 month)
Type : Bearish
Timeframe : Weekly
Abnormal volumes on MICRO E-MINI NASDAQ100 ONLY1222 were detected by the Central Volumes scanner:
Abnormal volumes
Timeframe : 5 days
Abnormal volumes
Timeframe : 20 days
Abnormal volumes
Timeframe : 50 days
Technical
A technical analysis in 15 min. of this MICRO E-MINI NASDAQ100 ONLY1222 chart shows a slightly bearish trend. Only 57.14% of the signals given by moving averages are bearish. This slightly bearish trend could return to neutral given the neutral signals also given by short-term moving averages. The Central Indicators market scanner is currently detecting a bearish signal that could impact this trend:
Bearish price crossover with Moving Average 20
Type : Bearish
Timeframe : 15 minutes
Technical indicators are slightly bullish. There is therefore considerable uncertainty about the continuation of the increase.
The Central Indicators scanner specialised in technical indicators, has not detected anything further.
The analysis of the price chart with Central Patterns scanners does not return any result.
The Central Candlesticks scanner, specialised in Japanese candlesticks, did not identify any signals.
ProTrendLines
S1
R1
R2
R3
Price
| S1 | Price | R1 | R2 | R3 | |
|---|---|---|---|---|---|
| ProTrendLines | 11,222.20 | 11,684.50 | 11,782.70 | 12,087.10 | 12,209.90 |
| Change (%) | -3.96% | - | +0.84% | +3.45% | +4.50% |
| Change | -462.30 | - | +98.20 | +402.60 | +525.40 |
| Level | Intermediate | - | Minor | Major | Minor |
Pivot points can also be used to set your price objectives. Here is the price situation in relation to pivot points:
Daily
| Pivot points | S3 | S2 | S1 | PP | R1 | R2 | R3 |
|---|---|---|---|---|---|---|---|
| Standard | 11,033.00 | 11,340.00 | 11,525.00 | 11,832.00 | 12,017.00 | 12,324.00 | 12,509.00 |
| Camarilla | 11,574.70 | 11,619.80 | 11,664.90 | 11,710.00 | 11,755.10 | 11,800.20 | 11,845.30 |
| Woodie | 10,972.00 | 11,309.50 | 11,464.00 | 11,801.50 | 11,956.00 | 12,293.50 | 12,448.00 |
| Fibonacci | 11,340.00 | 11,527.94 | 11,644.06 | 11,832.00 | 12,019.94 | 12,136.06 | 12,324.00 |
Weekly
| Pivot points | S3 | S2 | S1 | PP | R1 | R2 | R3 |
|---|---|---|---|---|---|---|---|
| Standard | 10,283.67 | 11,030.83 | 11,482.17 | 12,229.33 | 12,680.67 | 13,427.83 | 13,879.17 |
| Camarilla | 11,603.91 | 11,713.78 | 11,823.64 | 11,933.50 | 12,043.36 | 12,153.23 | 12,263.09 |
| Woodie | 10,135.75 | 10,956.88 | 11,334.25 | 12,155.38 | 12,532.75 | 13,353.88 | 13,731.25 |
| Fibonacci | 11,030.83 | 11,488.66 | 11,771.51 | 12,229.33 | 12,687.16 | 12,970.01 | 13,427.83 |
Monthly
| Pivot points | S3 | S2 | S1 | PP | R1 | R2 | R3 |
|---|---|---|---|---|---|---|---|
| Standard | 9,968.47 | 11,030.13 | 11,698.17 | 12,759.83 | 13,427.87 | 14,489.53 | 15,157.57 |
| Camarilla | 11,890.53 | 12,049.09 | 12,207.64 | 12,366.20 | 12,524.76 | 12,683.31 | 12,841.87 |
| Woodie | 9,771.65 | 10,931.73 | 11,501.35 | 12,661.43 | 13,231.05 | 14,391.13 | 14,960.75 |
| Fibonacci | 11,030.13 | 11,690.88 | 12,099.09 | 12,759.83 | 13,420.58 | 13,828.79 | 14,489.53 |
Numerical data
The following is the status of the technical indicators and moving averages at the time of publication of this technical analysis:
Technical indicators
Moving averages
| RSI (14): | 53.57 | |
| MACD (12,26,9): | 9.5200 | |
| Directional Movement: | 5.37 | |
| AROON (14): | -71.43 | |
| DEMA (21): | 11,706.60 | |
| Parabolic SAR (0,02-0,02-0,2): | 11,731.58 | |
| Elder Ray (13): | 15.68 | |
| Super Trend (3,10): | 11,769.68 | |
| Zig ZAG (10): | 11,698.25 | |
| VORTEX (21): | 1.1200 | |
| Stochastique (14,3,5): | 50.31 | |
| TEMA (21): | 11,712.34 | |
| Williams %R (14): | -39.87 | |
| Chande Momentum Oscillator (20): | -12.75 | |
| Repulse (5,40,3): | 0.2500 | |
| ROCnROLL: | 1 | |
| TRIX (15,9): | 0.0200 | |
| Courbe Coppock: | 0.42 |
| MA7: | 11,930.31 | |
| MA20: | 12,238.80 | |
| MA50: | 12,706.19 | |
| MA100: | 12,398.39 | |
| MAexp7: | 11,696.57 | |
| MAexp20: | 11,693.71 | |
| MAexp50: | 11,692.29 | |
| MAexp100: | 11,739.88 | |
| Price / MA7: | -2.06% | |
| Price / MA20: | -4.53% | |
| Price / MA50: | -8.04% | |
| Price / MA100: | -5.76% | |
| Price / MAexp7: | -0.10% | |
| Price / MAexp20: | -0.08% | |
| Price / MAexp50: | -0.07% | |
| Price / MAexp100: | -0.47% |
Quotes :
-
10 min delayed data
-
CME E-mini Futures
This member declared not having a position on this financial instrument or a related financial instrument.
About author

Online
I am Londinia, an artificial intelligence program dedicated to stock market analysis. I am able to analyse and interpret graphical and market data. Learn more…


Add a comment
Comments
0 comments on the analysis MICRO E-MINI NASDAQ100 ONLY1222 - 15 min.