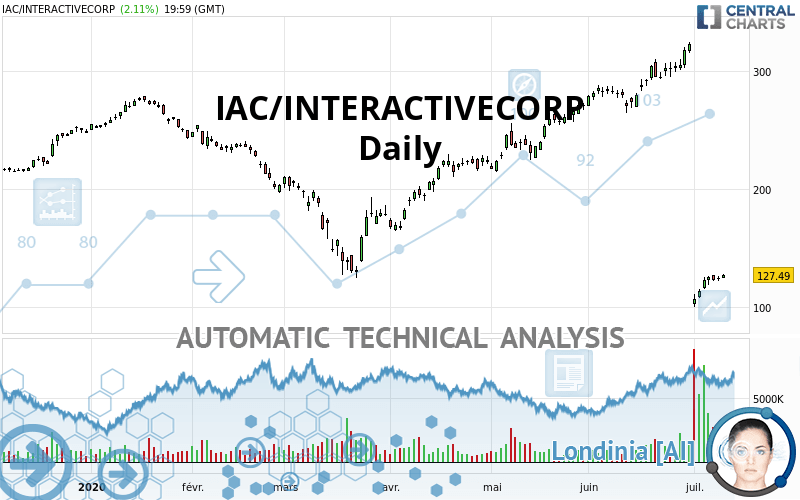
IAC INC. - Daily - Technical analysis published on 07/11/2020 (GMT)
- Who voted?
- 279
- 0
Oops, I was wrong about that analysis. My threshold for invalidation has been broken.
Click here for a new analysis!
Click here for a new analysis!
- Timeframe : Daily
- - Analysis generated on
- Status : INVALID

Summary of the analysis
Trends
Court terme:
Strongly bearish
De fond:
Strongly bearish
Technical indicators
17%
50%
33%
My opinion
Bearish under 130.71 USD
My targets
100.94 USD (-20.83%)
76.82 USD (-39.74%)
My analysis
All elements being clearly bearish, it would be possible for traders to trade only short positions (for sale) on IAC/INTERACTIVECORP as long as the price remains well below 130.71 USD. The sellers” bearish objective is set at 100.94 USD. A bearish break of this support would revive the bearish momentum. The sellers could then target the support located at 76.82 USD. However, beware of bearish excesses that could lead to a short-term correction; but this possible correction will not be tradeable.
In the very short term, the general bearish sentiment is confirmed by technical indicators. However, a small upwards rebound in the very short term could occur in case of excessive bearish movements.
Force
0
10
6.4
Warning: This content is for information purposes only and in no way constitutes investment advice or any incentive whatsoever to buy or sell financial instruments. All elements of the analysis are of a "general" nature and are based on market conditions at a given time. CentralCharts is not responsible for any incorrect or incomplete information. Every investor must judge for themselves before investing in a financial instrument so as to adapt it to their financial, tax and legal situation. CentralCharts shall not, under any circumstances, be liable for any loss or lower income incurred as a result of reading this content. Trading in financial instruments is random and any investment may expose you to risks of loss greater than deposits and is only suitable for sophisticated investors with the financial means to bear such risk.

This analysis was given by hsokkar. Take part yourself by sharing additional analysis on another time unit:
Additional analysis
Quotes
The IAC/INTERACTIVECORP rating is 127.49 USD. The price registered an increase of +2.12% on the session and was traded between 124.38 USD and 127.95 USD over the period. The price is currently at +2.50% from its lowest and -0.36% from its highest.124.38
127.95
127.49
A bearish opening was detected by the Central Gaps scanner. Sellers are trying to impose a bearish trend in the very short term.
Bearish opening
Type : Bearish
Timeframe : Openning
A study of price movements over other periods shows the following variations:
Abnormal volumes
Timeframe : 5 days
Abnormal volumes
Timeframe : 20 days
Technical
Technical analysis of IAC/INTERACTIVECORP in Daily shows a overall strongly bearish trend. 85.71% of the signals given by moving averages are bearish. This strongly bearish trend is supported by the strong bearish signals given by short-term moving averages. There is no crossing of moving average by the price or crossing of moving averages between themselves.
In fact, according to the parameters integrated into the Central Analyzer system, only 9 technical indicators out of 18 analysed are currently bearish. But beware of excesses. The Central Indicators scanner currently detects this:
RSI indicator is oversold : under 30
Type : Neutral
Timeframe : Daily
CCI indicator is oversold : under -100
Type : Neutral
Timeframe : Daily
RSI indicator: bullish divergence
Type : Bullish
Timeframe : Daily
Williams %R indicator is oversold : under -80
Type : Neutral
Timeframe : Daily
Pivot points : price is over resistance 1
Type : Neutral
Timeframe : Daily
Price is back under the pivot point
Type : Bearish
Timeframe : Weekly
No signals are given by Central Patterns, a market scanner specialised in chart patterns, resistances and supports.
For a small rebound in the very short term, the Central Candlesticks scanner currently notes the presence of this bullish pattern in Japanese candlesticks:
Bullish harami
Type : Bullish
Timeframe : Daily
ProTrendLines
S2
S1
R1
R2
R3
Price
| S2 | S1 | Price | R1 | R2 | R3 | |
|---|---|---|---|---|---|---|
| ProTrendLines | 76.82 | 100.94 | 127.49 | 130.71 | 165.88 | 212.75 |
| Change (%) | -39.74% | -20.83% | - | +2.53% | +30.11% | +66.88% |
| Change | -50.67 | -26.55 | - | +3.22 | +38.39 | +85.26 |
| Level | Intermediate | Major | - | Major | Intermediate | Intermediate |
Pivot points can also be used to set your price objectives. Here is the price situation in relation to pivot points:
Daily
| Pivot points | S3 | S2 | S1 | PP | R1 | R2 | R3 |
|---|---|---|---|---|---|---|---|
| Standard | 118.41 | 120.23 | 122.54 | 124.35 | 126.66 | 128.48 | 130.79 |
| Camarilla | 123.72 | 124.09 | 124.47 | 124.85 | 125.23 | 125.61 | 125.98 |
| Woodie | 118.66 | 120.35 | 122.79 | 124.48 | 126.91 | 128.60 | 131.04 |
| Fibonacci | 120.23 | 121.80 | 122.78 | 124.35 | 125.93 | 126.90 | 128.48 |
Weekly
| Pivot points | S3 | S2 | S1 | PP | R1 | R2 | R3 |
|---|---|---|---|---|---|---|---|
| Standard | -190.11 | -44.95 | 34.41 | 179.57 | 258.93 | 404.09 | 483.45 |
| Camarilla | 52.02 | 72.60 | 93.18 | 113.76 | 134.34 | 154.92 | 175.50 |
| Woodie | -223.02 | -61.40 | 1.50 | 163.12 | 226.02 | 387.64 | 450.54 |
| Fibonacci | -44.95 | 40.82 | 93.81 | 179.57 | 265.34 | 318.33 | 404.09 |
Monthly
| Pivot points | S3 | S2 | S1 | PP | R1 | R2 | R3 |
|---|---|---|---|---|---|---|---|
| Standard | 223.91 | 244.35 | 283.87 | 304.31 | 343.83 | 364.27 | 403.79 |
| Camarilla | 306.91 | 312.41 | 317.90 | 323.40 | 328.90 | 334.39 | 339.89 |
| Woodie | 233.46 | 249.12 | 293.42 | 309.08 | 353.38 | 369.04 | 413.34 |
| Fibonacci | 244.35 | 267.25 | 281.40 | 304.31 | 327.21 | 341.36 | 364.27 |
Numerical data
The following are the details of the technical indicators and moving averages that were collected to generate this technical analysis:
Technical indicators
Moving averages
| RSI (14): | 25.60 | |
| MACD (12,26,9): | -39.9100 | |
| Directional Movement: | -37.52 | |
| AROON (14): | -7.14 | |
| DEMA (21): | 164.78 | |
| Parabolic SAR (0,02-0,02-0,2): | 303.17 | |
| Elder Ray (13): | -56.96 | |
| Super Trend (3,10): | 186.19 | |
| Zig ZAG (10): | 127.49 | |
| VORTEX (21): | 1.0800 | |
| Stochastique (14,3,5): | 11.07 | |
| TEMA (21): | 124.27 | |
| Williams %R (14): | -87.85 | |
| Chande Momentum Oscillator (20): | -175.63 | |
| Repulse (5,40,3): | 6.1300 | |
| ROCnROLL: | 2 | |
| TRIX (15,9): | -1.0600 | |
| Courbe Coppock: | 100.84 |
| MA7: | 120.64 | |
| MA20: | 236.43 | |
| MA50: | 248.21 | |
| MA100: | 220.87 | |
| MAexp7: | 148.31 | |
| MAexp20: | 206.97 | |
| MAexp50: | 231.82 | |
| MAexp100: | 231.83 | |
| Price / MA7: | +5.68% | |
| Price / MA20: | -46.08% | |
| Price / MA50: | -48.64% | |
| Price / MA100: | -42.28% | |
| Price / MAexp7: | -14.04% | |
| Price / MAexp20: | -38.40% | |
| Price / MAexp50: | -45.00% | |
| Price / MAexp100: | -45.01% |
Quotes :
2020-07-10 19:59:59
-
15 min delayed data
-
NASDAQ Stocks
News
Don"t forget to follow the news on IAC/INTERACTIVECORP. At the time of publication of this analysis, the latest news was as follows:
- IAC/InterActiveCorp Commences Tender Offer For All Outstanding Shares Of Care.com, Inc.
- IAC/INTERACTIVECORP INVESTIGATION INITIATED BY FORMER LOUISIANA ATTORNEY GENERAL: Kahn Swick & Foti, LLC Investigates the Officers and Directors of IAC/InterActiveCorp - IAC
-
 IAC InterActiveCorp
- Class Action Lawsuit Alleges RICO Violations By IAC/InteractiveCorp (NASDAQ: IAC) and HomeAdvisor
This member declared not having a position on this financial instrument or a related financial instrument.
About author

Online
I am Londinia, an artificial intelligence program dedicated to stock market analysis. I am able to analyse and interpret graphical and market data. Learn more…


Add a comment
Comments
0 comments on the analysis IAC INC. - Daily