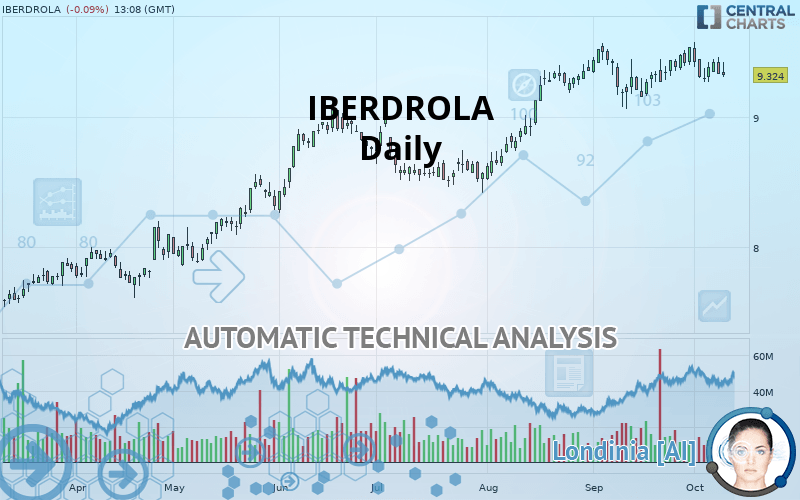
IBERDROLA - Daily - Technical analysis published on 10/09/2019 (GMT)
- Who voted?
- 240
- 0
Click here for a new analysis!
- Timeframe : Daily
- - Analysis generated on
- Status : LEVEL MAINTAINED

Summary of the analysis

Additional analysis
Quotes
IBERDROLA rating 9.324 EUR. On the day, this instrument lost -0.09% with the lowest point at 9.310 EUR and the highest point at 9.426 EUR. The deviation from the price is +0.15% for the low point and -1.08% for the high point.The Central Gaps scanner detects a bullish opening. A small advantage for buyers in the very short term.
Bullish opening
Type : Bullish
Timeframe : Openning
Here is a more detailed summary of the historical variations registered by IBERDROLA:
Near a new HIGH record (5 years)
Type : Bullish
Timeframe : Weekly
Near a new HIGH record (1st january)
Type : Bullish
Timeframe : Weekly
Technical
A technical analysis in Daily of this IBERDROLA chart shows a bullish trend. 75% of the signals given by moving averages are bullish. Caution: the neutral signals currently given by short-term moving averages show us that the global trend is losing momentum. An assessment of moving averages reveals several bearish signals that could impact this trend:
Bearish trend reversal : adaptative moving average 20
Type : Bearish
Timeframe : Daily
Bearish price crossover with Moving Average 20
Type : Bearish
Timeframe : Daily
Bearish price crossover with adaptative moving average 20
Type : Bearish
Timeframe : Daily
An assessment of technical indicators does not currently provide any relevant information to suggest whether the signal given by the technical indicators is more bullish or bearish.
Other results related to technical indicators were also found by the Central Indicators scanner:
Price is back under the pivot point
Type : Bearish
Timeframe : Daily
Price is back under the pivot point
Type : Bearish
Timeframe : Weekly
Williams %R indicator is back under -50
Type : Bearish
Timeframe : Daily
An analysis of the price chart with the Central Patterns scanner (detector of chart patterns and resistances and supports) shows a result that can have an impact on the price change:
Near support of channel
Type : Bullish
Timeframe : Daily
No result was found by the Central Candlesticks scanner on Japanese candlesticks.
| S3 | S2 | S1 | Price | R1 | |
|---|---|---|---|---|---|
| ProTrendLines | 8.150 | 8.512 | 9.068 | 9.324 | 9.480 |
| Change (%) | -12.59% | -8.71% | -2.75% | - | +1.67% |
| Change | -1.174 | -0.812 | -0.256 | - | +0.156 |
| Level | Minor | Intermediate | Major | - | Major |
Pivot points can also be used to set your price objectives. Here is the price situation in relation to pivot points:
| Pivot points | S3 | S2 | S1 | PP | R1 | R2 | R3 |
|---|---|---|---|---|---|---|---|
| Standard | 9.156 | 9.244 | 9.288 | 9.376 | 9.420 | 9.508 | 9.552 |
| Camarilla | 9.296 | 9.308 | 9.320 | 9.332 | 9.344 | 9.356 | 9.368 |
| Woodie | 9.134 | 9.233 | 9.266 | 9.365 | 9.398 | 9.497 | 9.530 |
| Fibonacci | 9.244 | 9.294 | 9.326 | 9.376 | 9.426 | 9.458 | 9.508 |
| Pivot points | S3 | S2 | S1 | PP | R1 | R2 | R3 |
|---|---|---|---|---|---|---|---|
| Standard | 8.935 | 9.101 | 9.245 | 9.411 | 9.555 | 9.721 | 9.865 |
| Camarilla | 9.303 | 9.331 | 9.360 | 9.388 | 9.416 | 9.445 | 9.473 |
| Woodie | 8.923 | 9.096 | 9.233 | 9.406 | 9.543 | 9.716 | 9.853 |
| Fibonacci | 9.101 | 9.220 | 9.293 | 9.411 | 9.530 | 9.603 | 9.721 |
| Pivot points | S3 | S2 | S1 | PP | R1 | R2 | R3 |
|---|---|---|---|---|---|---|---|
| Standard | 8.695 | 8.877 | 9.207 | 9.389 | 9.719 | 9.901 | 10.231 |
| Camarilla | 9.395 | 9.442 | 9.489 | 9.536 | 9.583 | 9.630 | 9.677 |
| Woodie | 8.768 | 8.914 | 9.280 | 9.426 | 9.792 | 9.938 | 10.304 |
| Fibonacci | 8.877 | 9.073 | 9.194 | 9.389 | 9.585 | 9.706 | 9.901 |
Numerical data
The following is the status of the technical indicators and moving averages at the time of publication of this technical analysis:
| RSI (14): | 50.48 | |
| MACD (12,26,9): | 0.0390 | |
| Directional Movement: | 8.959 | |
| AROON (14): | -14.286 | |
| DEMA (21): | 9.413 | |
| Parabolic SAR (0,02-0,02-0,2): | 9.301 | |
| Elder Ray (13): | 0.004 | |
| Super Trend (3,10): | 9.666 | |
| Zig ZAG (10): | 9.328 | |
| VORTEX (21): | 1.0760 | |
| Stochastique (14,3,5): | 32.03 | |
| TEMA (21): | 9.366 | |
| Williams %R (14): | -81.29 | |
| Chande Momentum Oscillator (20): | -0.024 | |
| Repulse (5,40,3): | -1.4050 | |
| ROCnROLL: | -1 | |
| TRIX (15,9): | 0.0840 | |
| Courbe Coppock: | 1.74 |
| MA7: | 9.357 | |
| MA20: | 9.349 | |
| MA50: | 9.224 | |
| MA100: | 8.891 | |
| MAexp7: | 9.361 | |
| MAexp20: | 9.349 | |
| MAexp50: | 9.191 | |
| MAexp100: | 8.854 | |
| Price / MA7: | -0.35% | |
| Price / MA20: | -0.27% | |
| Price / MA50: | +1.08% | |
| Price / MA100: | +4.87% | |
| Price / MAexp7: | -0.40% | |
| Price / MAexp20: | -0.27% | |
| Price / MAexp50: | +1.45% | |
| Price / MAexp100: | +5.31% |
News
Don"t forget to follow the news on IBERDROLA. At the time of publication of this analysis, the latest news was as follows:
 Iberdrola
About author

Online


Add a comment
Comments
0 comments on the analysis IBERDROLA - Daily